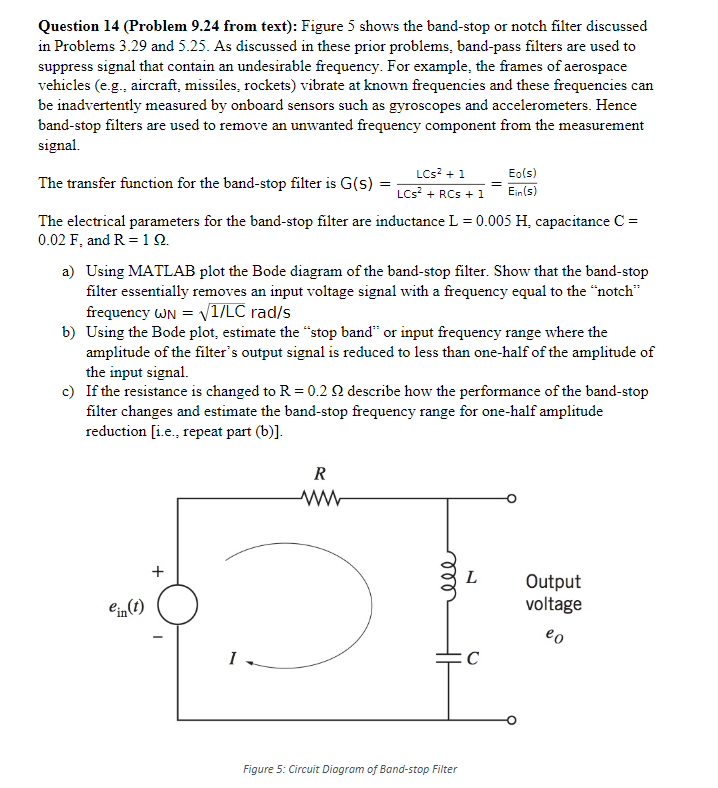
Question: Question 14 (Problem 9.24 from text): Figure 5 shows the band-stop or notch filter discussed in Problems 3.29 and 5.25. As discussed in these prior

Question 14 (Problem 9.24 from text): Figure 5
Question 14 (Problem 9.24 from text): Figure 5 shows the band-stop or notch filter discussed in Problems 3.29 and 5.25. As discussed in these prior problems, band-pass filters are used to suppress signal that contain an undesirable frequency. For example, the frames of aerospace vehicles (e.g., aircraft, missiles, rockets) vibrate at known frequencies and these frequencies can be inadvertently measured by onboard sensors such as gyroscopes and accelerometers. Hence band-stop filters are used to remove an unwanted frequency component from the measurement signal. LOS2 + 1 Eo(s) The transfer function for the band-stop filter is G(5) = LCS + RCs + 1 Ein (s) The electrical parameters for the band-stop filter are inductance L = 0.005 H. capacitance C = 0.02 F, and R = 1 0. a) Using MATLAB plot the Bode diagram of the band-stop filter. Show that the band-stop filter essentially removes an input voltage signal with a frequency equal to the "notch" frequency WN = V1/LC rad/5 b) Using the Bode plot, estimate the "stop band" or input frequency range where the amplitude of the filter's output signal is reduced to less than one-half of the amplitude of the input signal. c) If the resistance is changed to R = 0.2 2 describe how the performance of the band-stop filter changes and estimate the band-stop frequency range for one-half amplitude reduction [i.e., repeat part (b)] R WW L Output ein (t) voltage co I C Figure 5: Circuit Diagram of Band-stop Filter

Step by Step Solution

There are 3 Steps involved in it

1 Expert Approved Answer
Step: 1 Unlock blur-text-image
Question Has Been Solved by an Expert!

Get step-by-step solutions from verified subject matter experts

Step: 2 Unlock
Step: 3 Unlock

Students Have Also Explored These Related Mathematics Questions!