

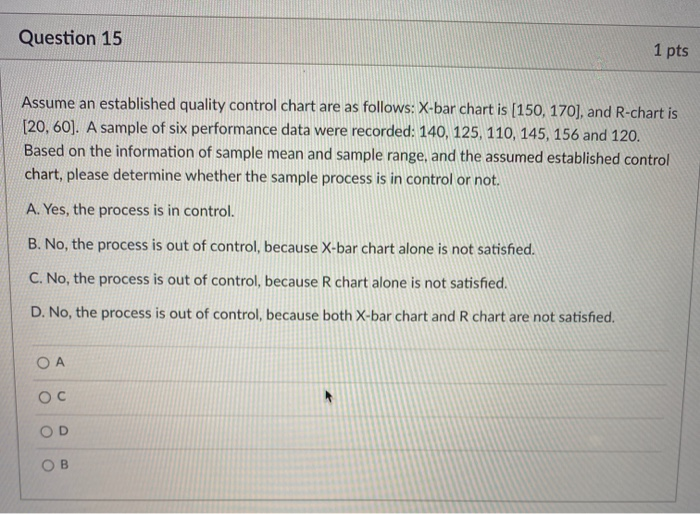
Question: Question 15 1 pts Assume an established quality control chart are as follows: X-bar chart is [150, 170), and R-chart is [20, 60). A sample
Step by Step Solution
There are 3 Steps involved in it
1 Expert Approved Answer
Step: 1 Unlock

Question Has Been Solved by an Expert!
Get step-by-step solutions from verified subject matter experts
Step: 2 Unlock
Step: 3 Unlock