

Question: Question 15 The graph below shows the supply and demand curves for soda. Hint 12 Price Floor Demand 10+ 8 - Price of soda Supply
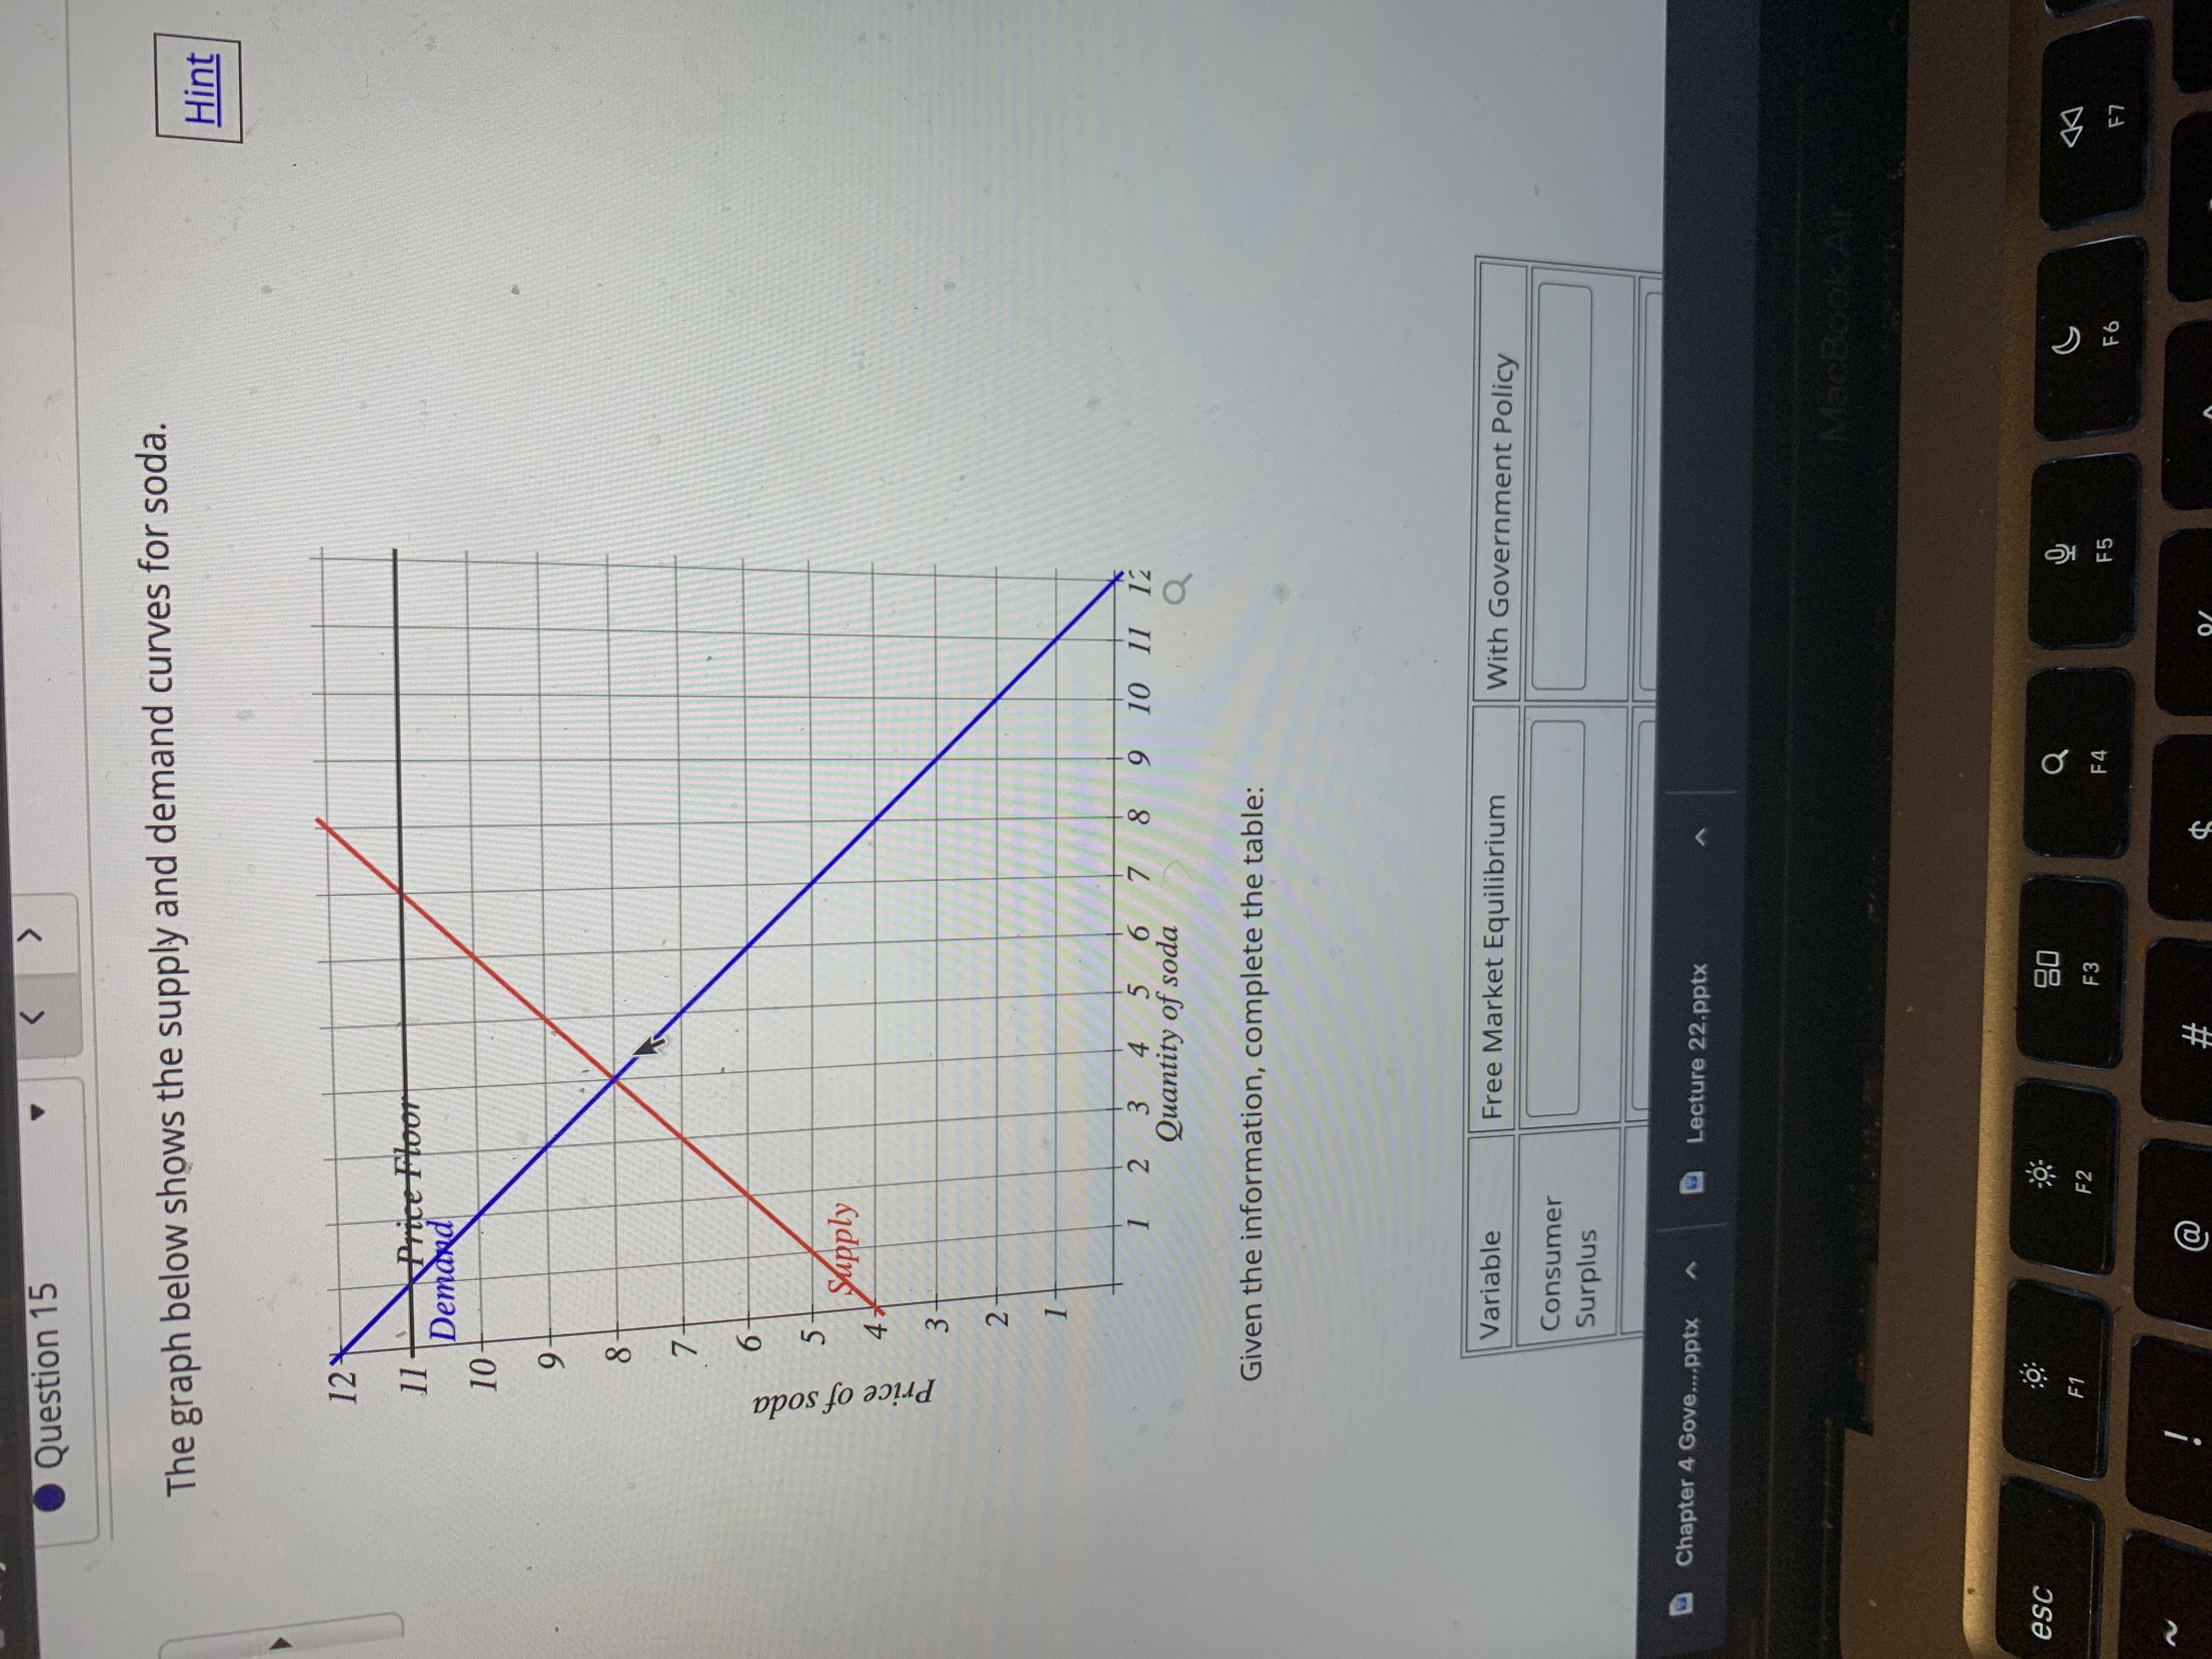
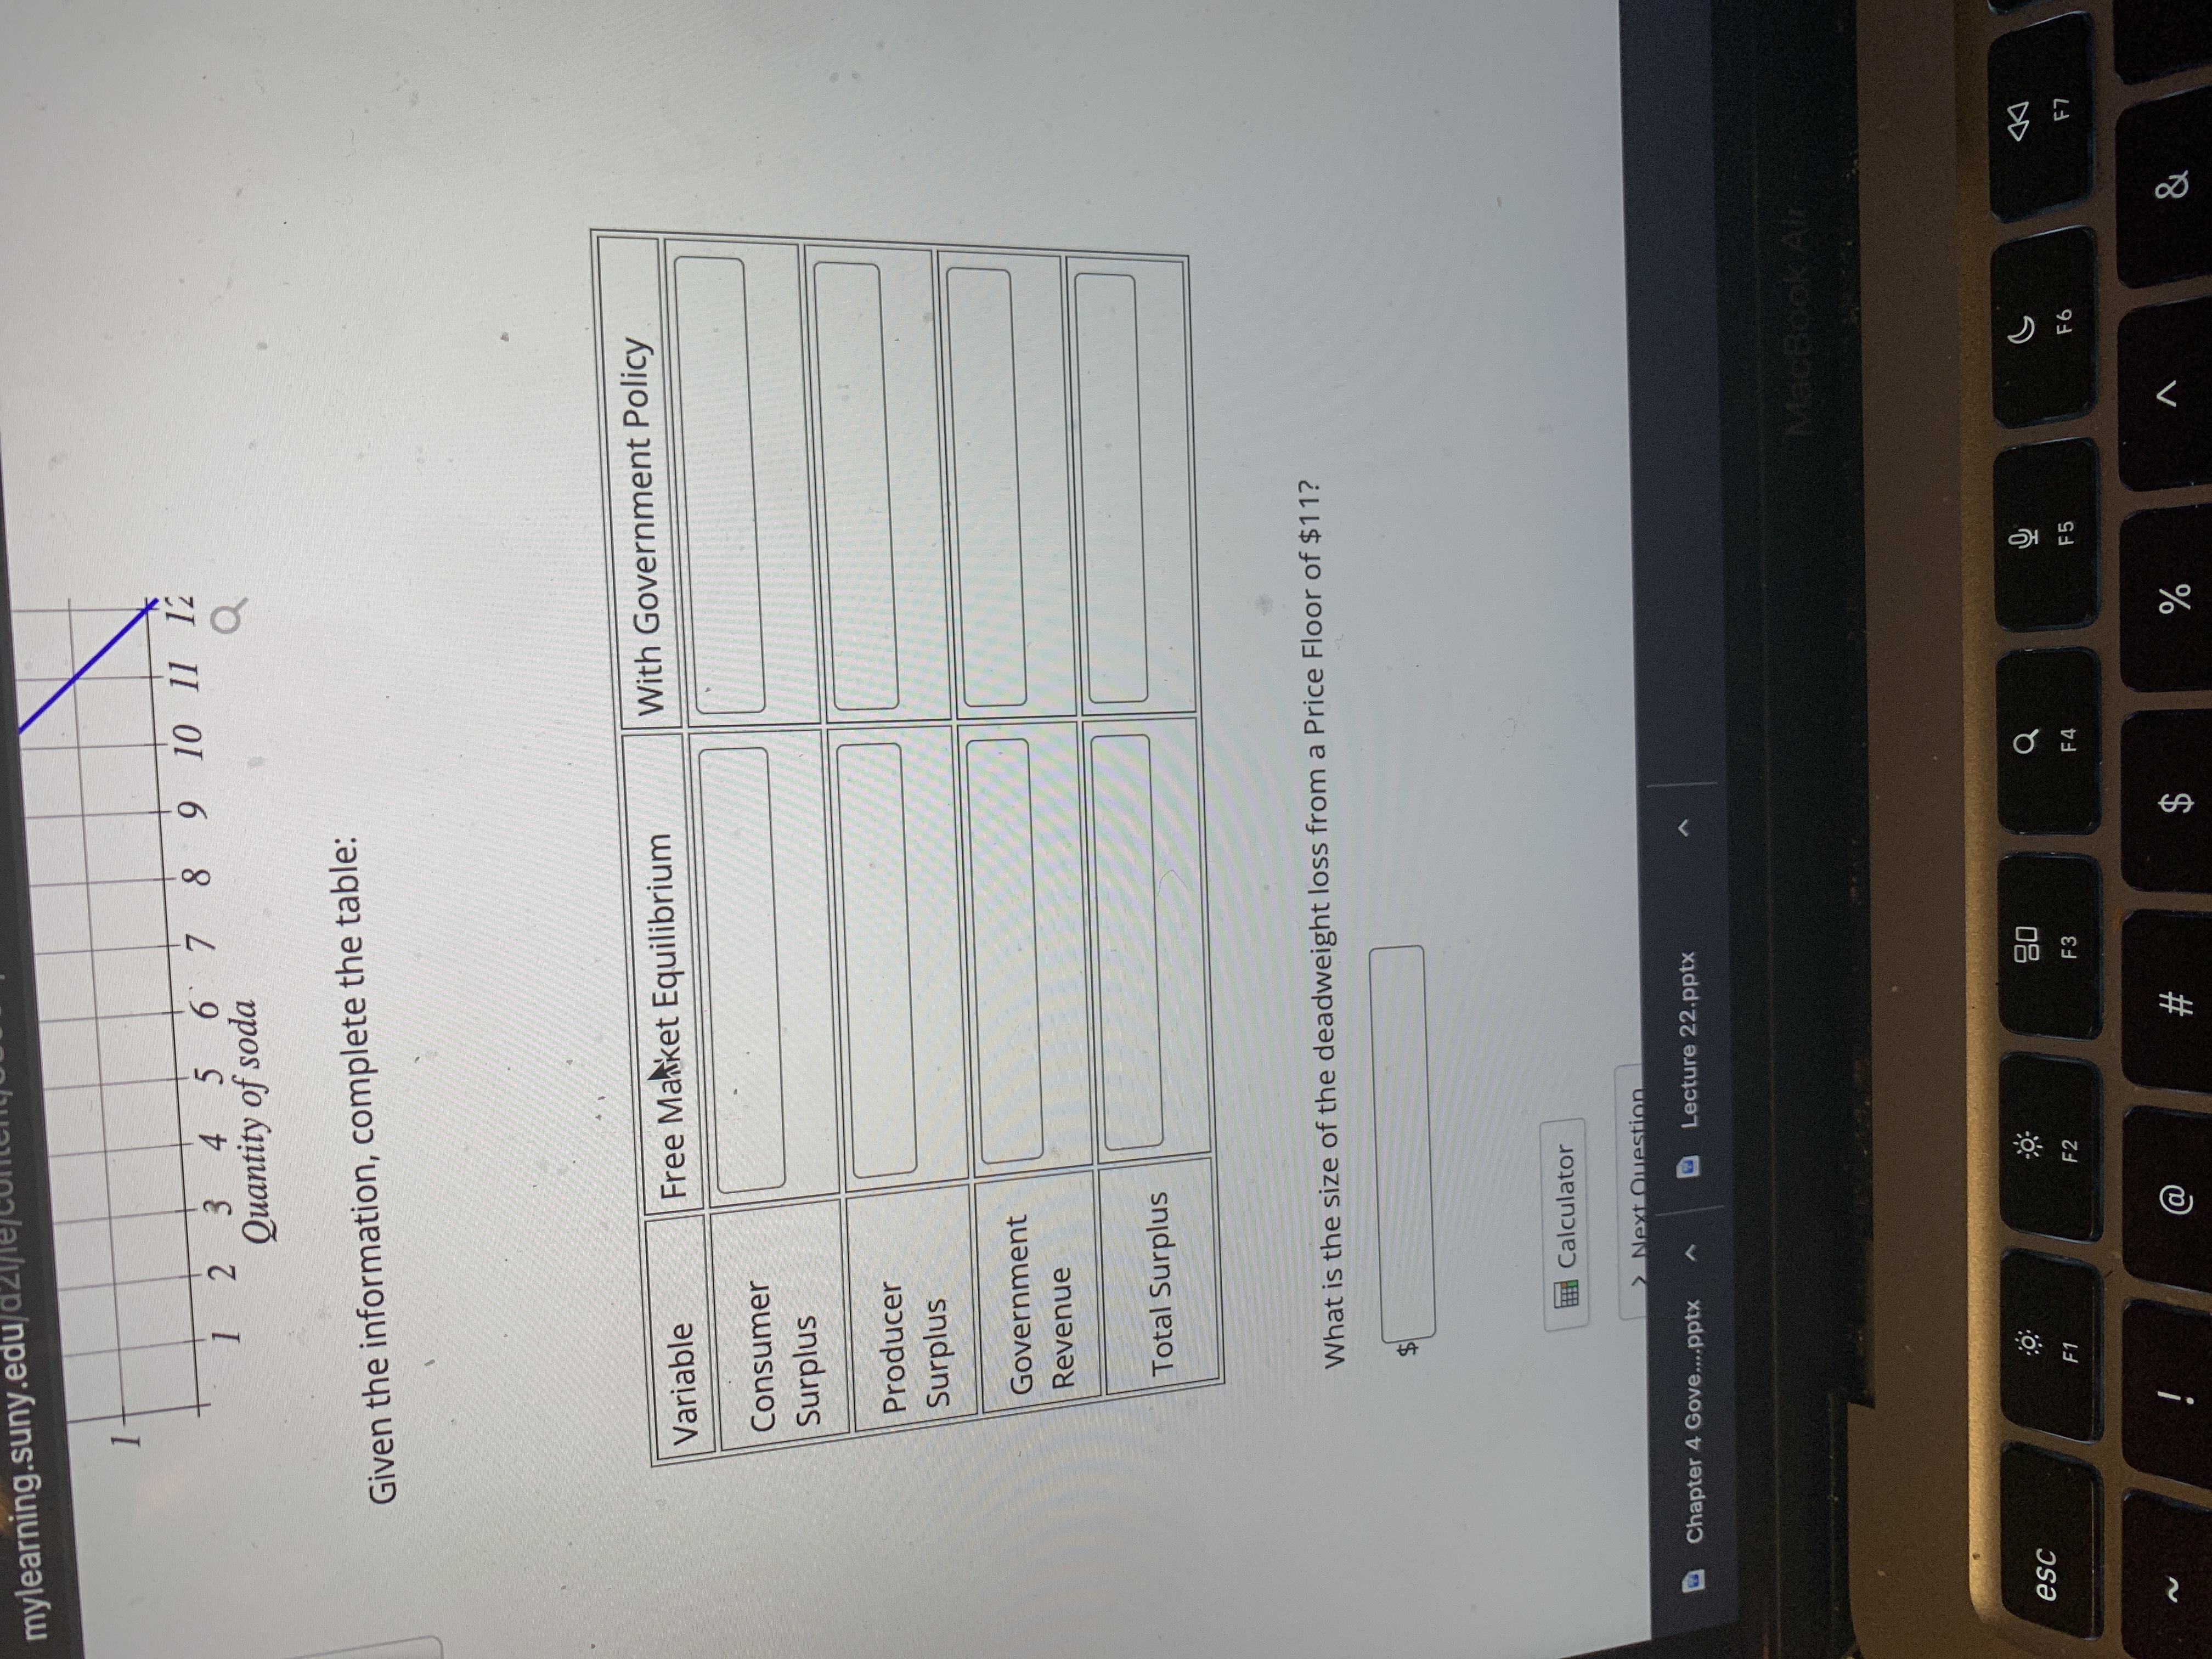


Question 15 The graph below shows the supply and demand curves for soda. Hint 12 Price Floor Demand 10+ 8 - Price of soda Supply 4 N W 2 3 4 5 6 7 8 9 10 11 12 Quantity of soda Q Given the information, complete the table: Variable Free Market Equilibrium With Government Policy Consumer Surplus Chapter 4 Gove..,.pptx Lecture 22.pptx ManBook Ally esc O'- 20 F1 F2 F3 F4 F5 F6 F7 a #mylearning.suny.edu/azi/le/c 2 3 5 6 7 8 9 10 11 12 Quantity of soda Q Given the information, complete the table: Variable Free Market Equilibrium With Government Policy Consumer Surplus Producer Surplus Government Revenue Total Surplus What is the size of the deadweight loss from a Price Floor of $11? Calculator > Next Question Chapter 4 Gove....pptx Lecture 22.pptx MacBook Air esc CO- F1 F2 F3 F4 F5 F6 F7 $ &
Step by Step Solution
There are 3 Steps involved in it

Get step-by-step solutions from verified subject matter experts