

Question: Question 17 (1 point) The following table contains the data taken on the number of total study hours (HOURS) over the semester and the final

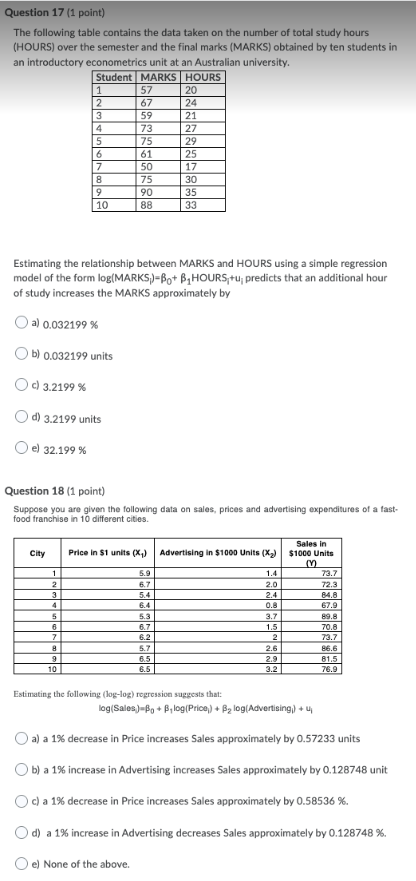
Question 17 (1 point) The following table contains the data taken on the number of total study hours (HOURS) over the semester and the final marks (MARKS) obtained by ten students in an introductory econometrics unit at an Australian university. Student MARKS HOURS 1 57 20 2 67 24 3 59 21 4 73 27 5 75 29 61 25 7 50 17 8 75 30 90 35 10 38 33 Estimating the relationship between MARKS and HOURS using a simple regression model of the form log(MARKS )=Bo+ B, HOURS +up predicts that an additional hour of study increases the MARKS approximately by ( a) 0.032199 % ( b) 0.032199 units O c 3.2199 % ( d) 3.2199 units O el 32.199 % Question 18 (1 point) Suppose you are given the following data on sales, prices and advertising expenditures of a fast- food franchise in 10 different cities. Sales in City Price in $1 units (X) Advertising in $1000 Units (X2) $1000 Units m 6.9 1.4 73.7 2 6.7 2.0 72.2 3 5.4 2.4 84.8 4 6.4 0.8 5 5.3 3.7 89.8 6.7 1.5 70.8 7 6.2 2 73.7 5.7 2.6 86.6 6.5 2.9 81.5 10 6.5 3.2 76.9 Estimating the following (log-log) regression suggests that: log(Sales )=Bo + B, log[Price,) + By log[Advertising) + uj ( a) a 1%% decrease in Price increases Sales approximately by 0.57233 units b) a 1% increase in Advertising increases Sales approximately by 0.128748 unit O c) a 1% decrease in Price increases Sales approximately by 0.58536 %. ( d) a 1% increase in Advertising decreases Sales approximately by 0.128748 %. O el None of the above
Step by Step Solution
There are 3 Steps involved in it

Get step-by-step solutions from verified subject matter experts