

Question: Question 17 1 Point The table below contains annual data on UK stock returns (denoted by x) and US stock returns (denoted by over the
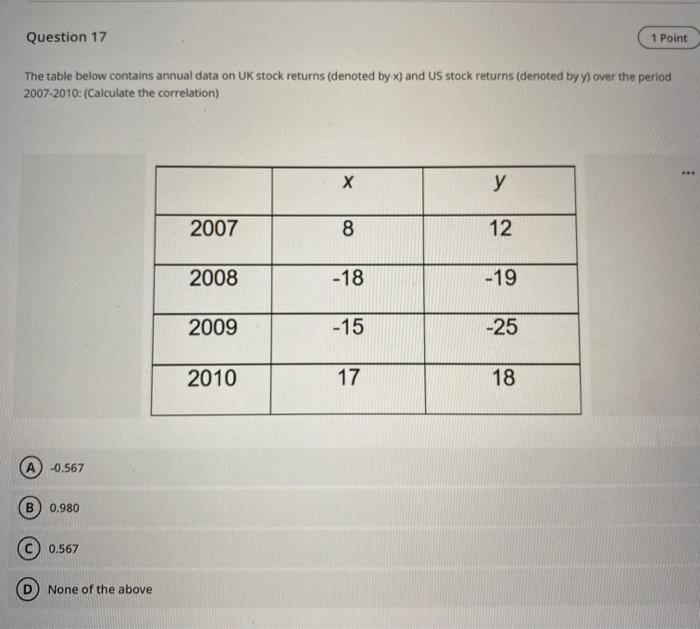
Question 17 1 Point The table below contains annual data on UK stock returns (denoted by x) and US stock returns (denoted by over the period 2007-2010: (Calculate the correlation) y 2007 8 12 2008 -18 -19 2009 -15 -25 2010 17 18 -0.567 B 0.980 0.567 None of the above
Step by Step Solution
There are 3 Steps involved in it
1 Expert Approved Answer
Step: 1 Unlock

Question Has Been Solved by an Expert!
Get step-by-step solutions from verified subject matter experts
Step: 2 Unlock
Step: 3 Unlock