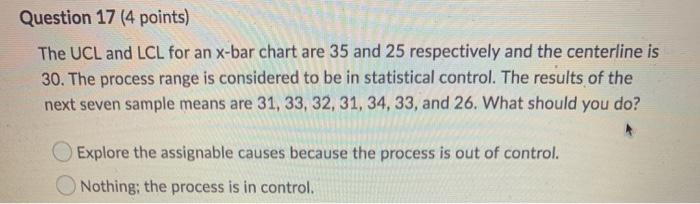
Question: Question 17 (4 points) The UCL and LCL for an x-bar chart are 35 and 25 respectively and the centerline is 30. The process range

Question 17 (4 points) The UCL and LCL for an
Question 17 (4 points) The UCL and LCL for an x-bar chart are 35 and 25 respectively and the centerline is 30. The process range is considered to be in statistical control. The results of the next seven sample means are 31, 33, 32, 31, 34, 33, and 26. What should you do? Explore the assignable causes because the process is out of control. Nothing; the process is in control

Step by Step Solution

There are 3 Steps involved in it

1 Expert Approved Answer
Step: 1 Unlock blur-text-image
Question Has Been Solved by an Expert!

Get step-by-step solutions from verified subject matter experts

Step: 2 Unlock
Step: 3 Unlock

Students Have Also Explored These Related General Management Questions!