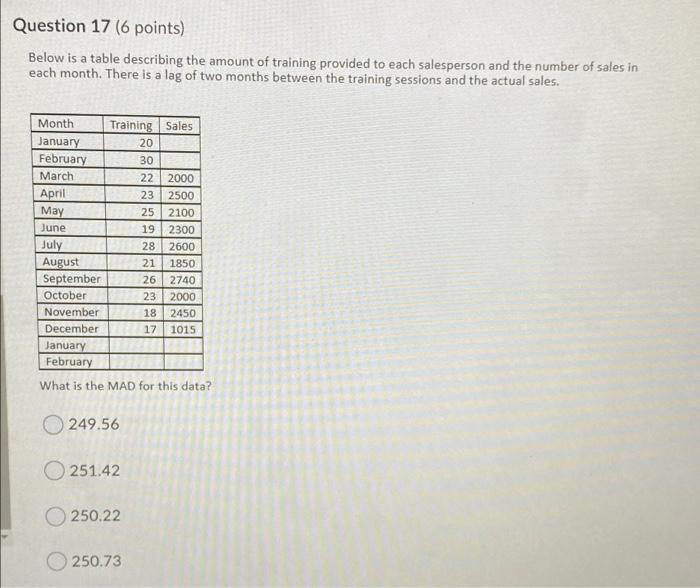
Question: Question 17 (6 points) Below is a table describing the amount of training provided to each salesperson and the number of sales in each month.

Question 17 (6 points) Below is a table
Question 17 (6 points) Below is a table describing the amount of training provided to each salesperson and the number of sales in each month. There is a lag of two months between the training sessions and the actual sales. Month Training Sales January 20 February 30 March 22 2000 April 23 2500 May 25 2100 June 19 2300 July 28 2600 August 21 1850 September 26 2740 October 23 2000 November 18 2450 December 17 1015 January February What is the MAD for this data? 249.56 251.42 250.22 250.73

Step by Step Solution

There are 3 Steps involved in it

1 Expert Approved Answer
Step: 1 Unlock blur-text-image
Question Has Been Solved by an Expert!

Get step-by-step solutions from verified subject matter experts

Step: 2 Unlock
Step: 3 Unlock

Students Have Also Explored These Related General Management Questions!