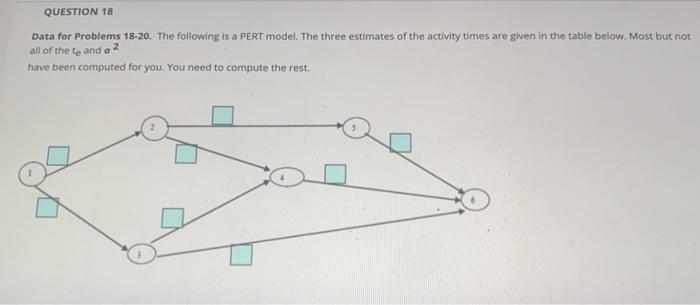
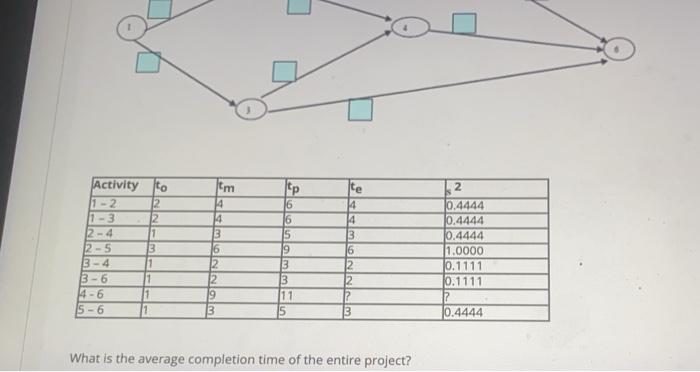
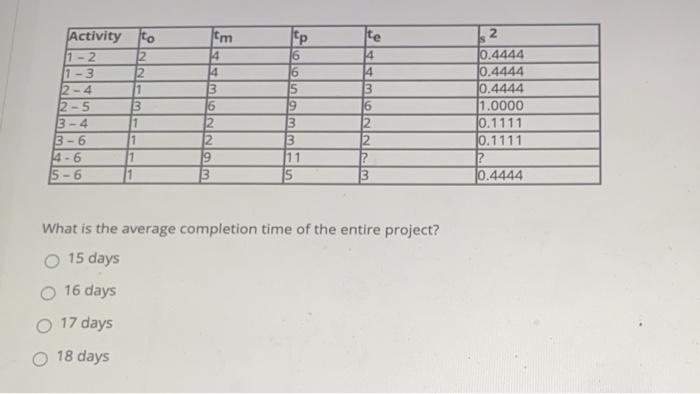
Question: QUESTION 18 Data for Problems 18-20. The following is a PERT model. The three estimates of the activity times are given in the table below.

QUESTION 18 Data for Problems 18-20. The
QUESTION 18 Data for Problems 18-20. The following is a PERT model. The three estimates of the activity times are given in the table below. Most but not all of the le and o? have been computed for you. You need to compute the rest. tp 2 Activity to 11-2 12 1-3 2 2-4 11 2-5 3-4 11 3-6 1 14-6 1 5-6 1 tm 14 14 3 16 2 2 19 3 16 16 5 19 3 3 11 te 14 14 3 16 2 2 2 3 0.4444 0.4444 0.4444 1.0000 10.1111 10.1111 ? 0.4444 What is the average completion time of the entire project? tm 4 14 lp 16 16 5 Activity to 11-2 12 11-3 12-4 11 12-5 3 3-4 1 13-6 1 146 15-6 1 te 14 14 3 16 2 2 0.4444 10.4444 0.4444 1.0000 10.1111 10.1111 ? 0.4444 3 3 11 15 What is the average completion time of the entire project? 15 days 16 days 17 days O 18 days QUESTION 19 What is standard deviation of the project completion time"? O 1.972 1.915 O 2.055 1.826 QUESTION 20 What is the probability that the project will be completed within 20 days? 0.8340 0.9357 O 0.9817 0.9955

Step by Step Solution

There are 3 Steps involved in it

1 Expert Approved Answer
Step: 1 Unlock blur-text-image
Question Has Been Solved by an Expert!

Get step-by-step solutions from verified subject matter experts

Step: 2 Unlock
Step: 3 Unlock

Students Have Also Explored These Related General Management Questions!