

Question: QUESTION 18 Note: No referencing is required for short answer questions. The graphs below show the Australian and Korean domestic car industries. (a) Explain the

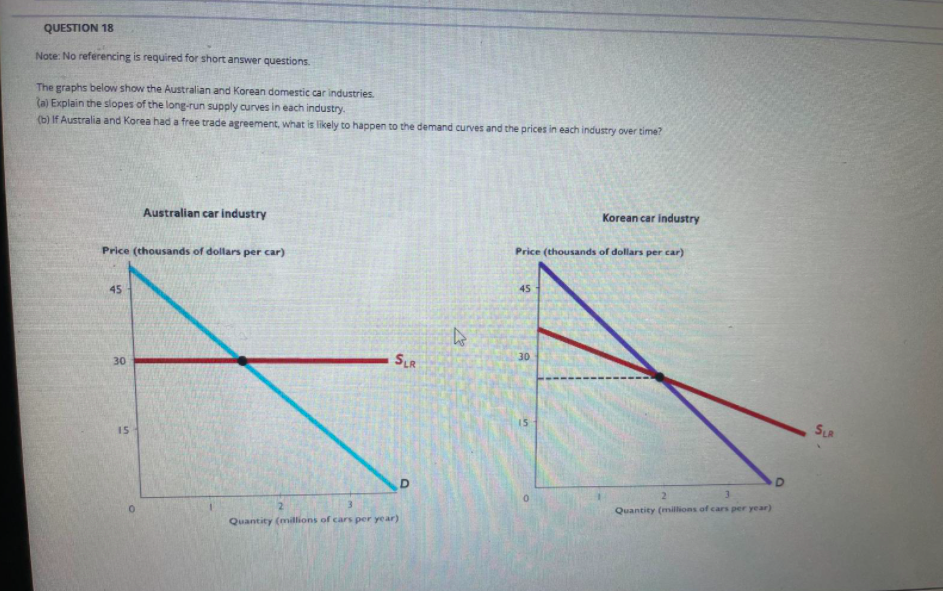
QUESTION 18 Note: No referencing is required for short answer questions. The graphs below show the Australian and Korean domestic car industries. (a) Explain the slopes of the long-run supply curves in each industry. (b) If Australia and Korea had a free trade agreement, what is likely to happen to the demand curves and the prices in each industry over time? Australian car industry Korean car industry Price (thousands of dollars per car) Price (thousands of dollars per car) 30 SLR 15 SLA 15 D 2 2 Quantity ( millions of cars per year) Quantity (millions of cars per year)
Step by Step Solution
There are 3 Steps involved in it
1 Expert Approved Answer
Step: 1 Unlock

Question Has Been Solved by an Expert!
Get step-by-step solutions from verified subject matter experts
Step: 2 Unlock
Step: 3 Unlock