

Question: QUESTION 18 Using the data in the following table, Year Stock A Stock B 2004 2005 2006 2007 2008 -10% 209 20% 5% 10%
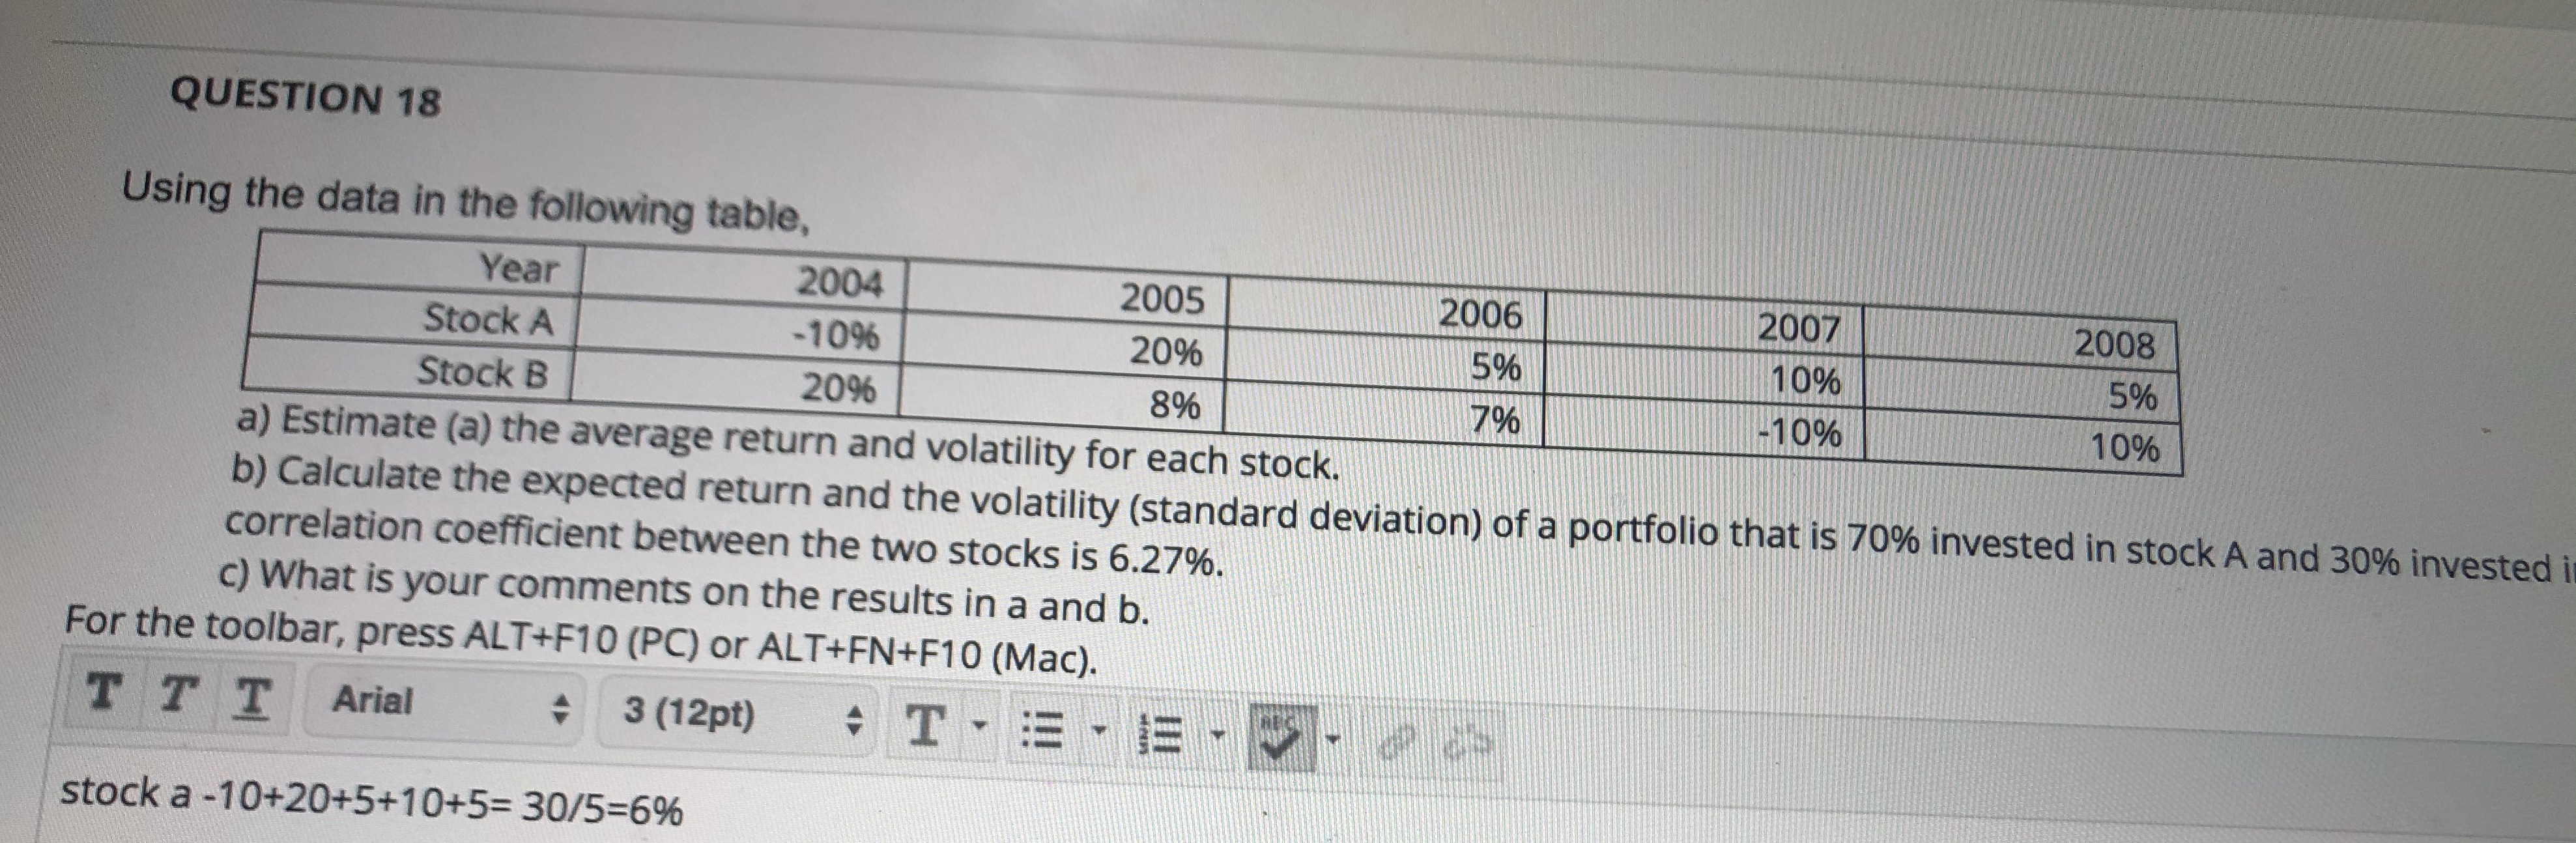
QUESTION 18 Using the data in the following table, Year Stock A Stock B 2004 2005 2006 2007 2008 -10% 209 20% 5% 10% 5% 8% 7% -10% 10% a) Estimate (a) the average return and volatility for each stock. b) Calculate the expected return and the volatility (standard deviation) of a portfolio that is 70% invested in stock A and 30% invested i correlation coefficient between the two stocks is 6.27%. c) What is your comments on the results in a and b. For the toolbar, press ALT+F10 (PC) or ALT+FN+F10 (Mac). TTT Arial 3 (12pt) stock a -10+20+5+10+5= 30/5=6% T TEE
Step by Step Solution
There are 3 Steps involved in it
1 Expert Approved Answer
Step: 1 Unlock

Question Has Been Solved by an Expert!
Get step-by-step solutions from verified subject matter experts
Step: 2 Unlock
Step: 3 Unlock