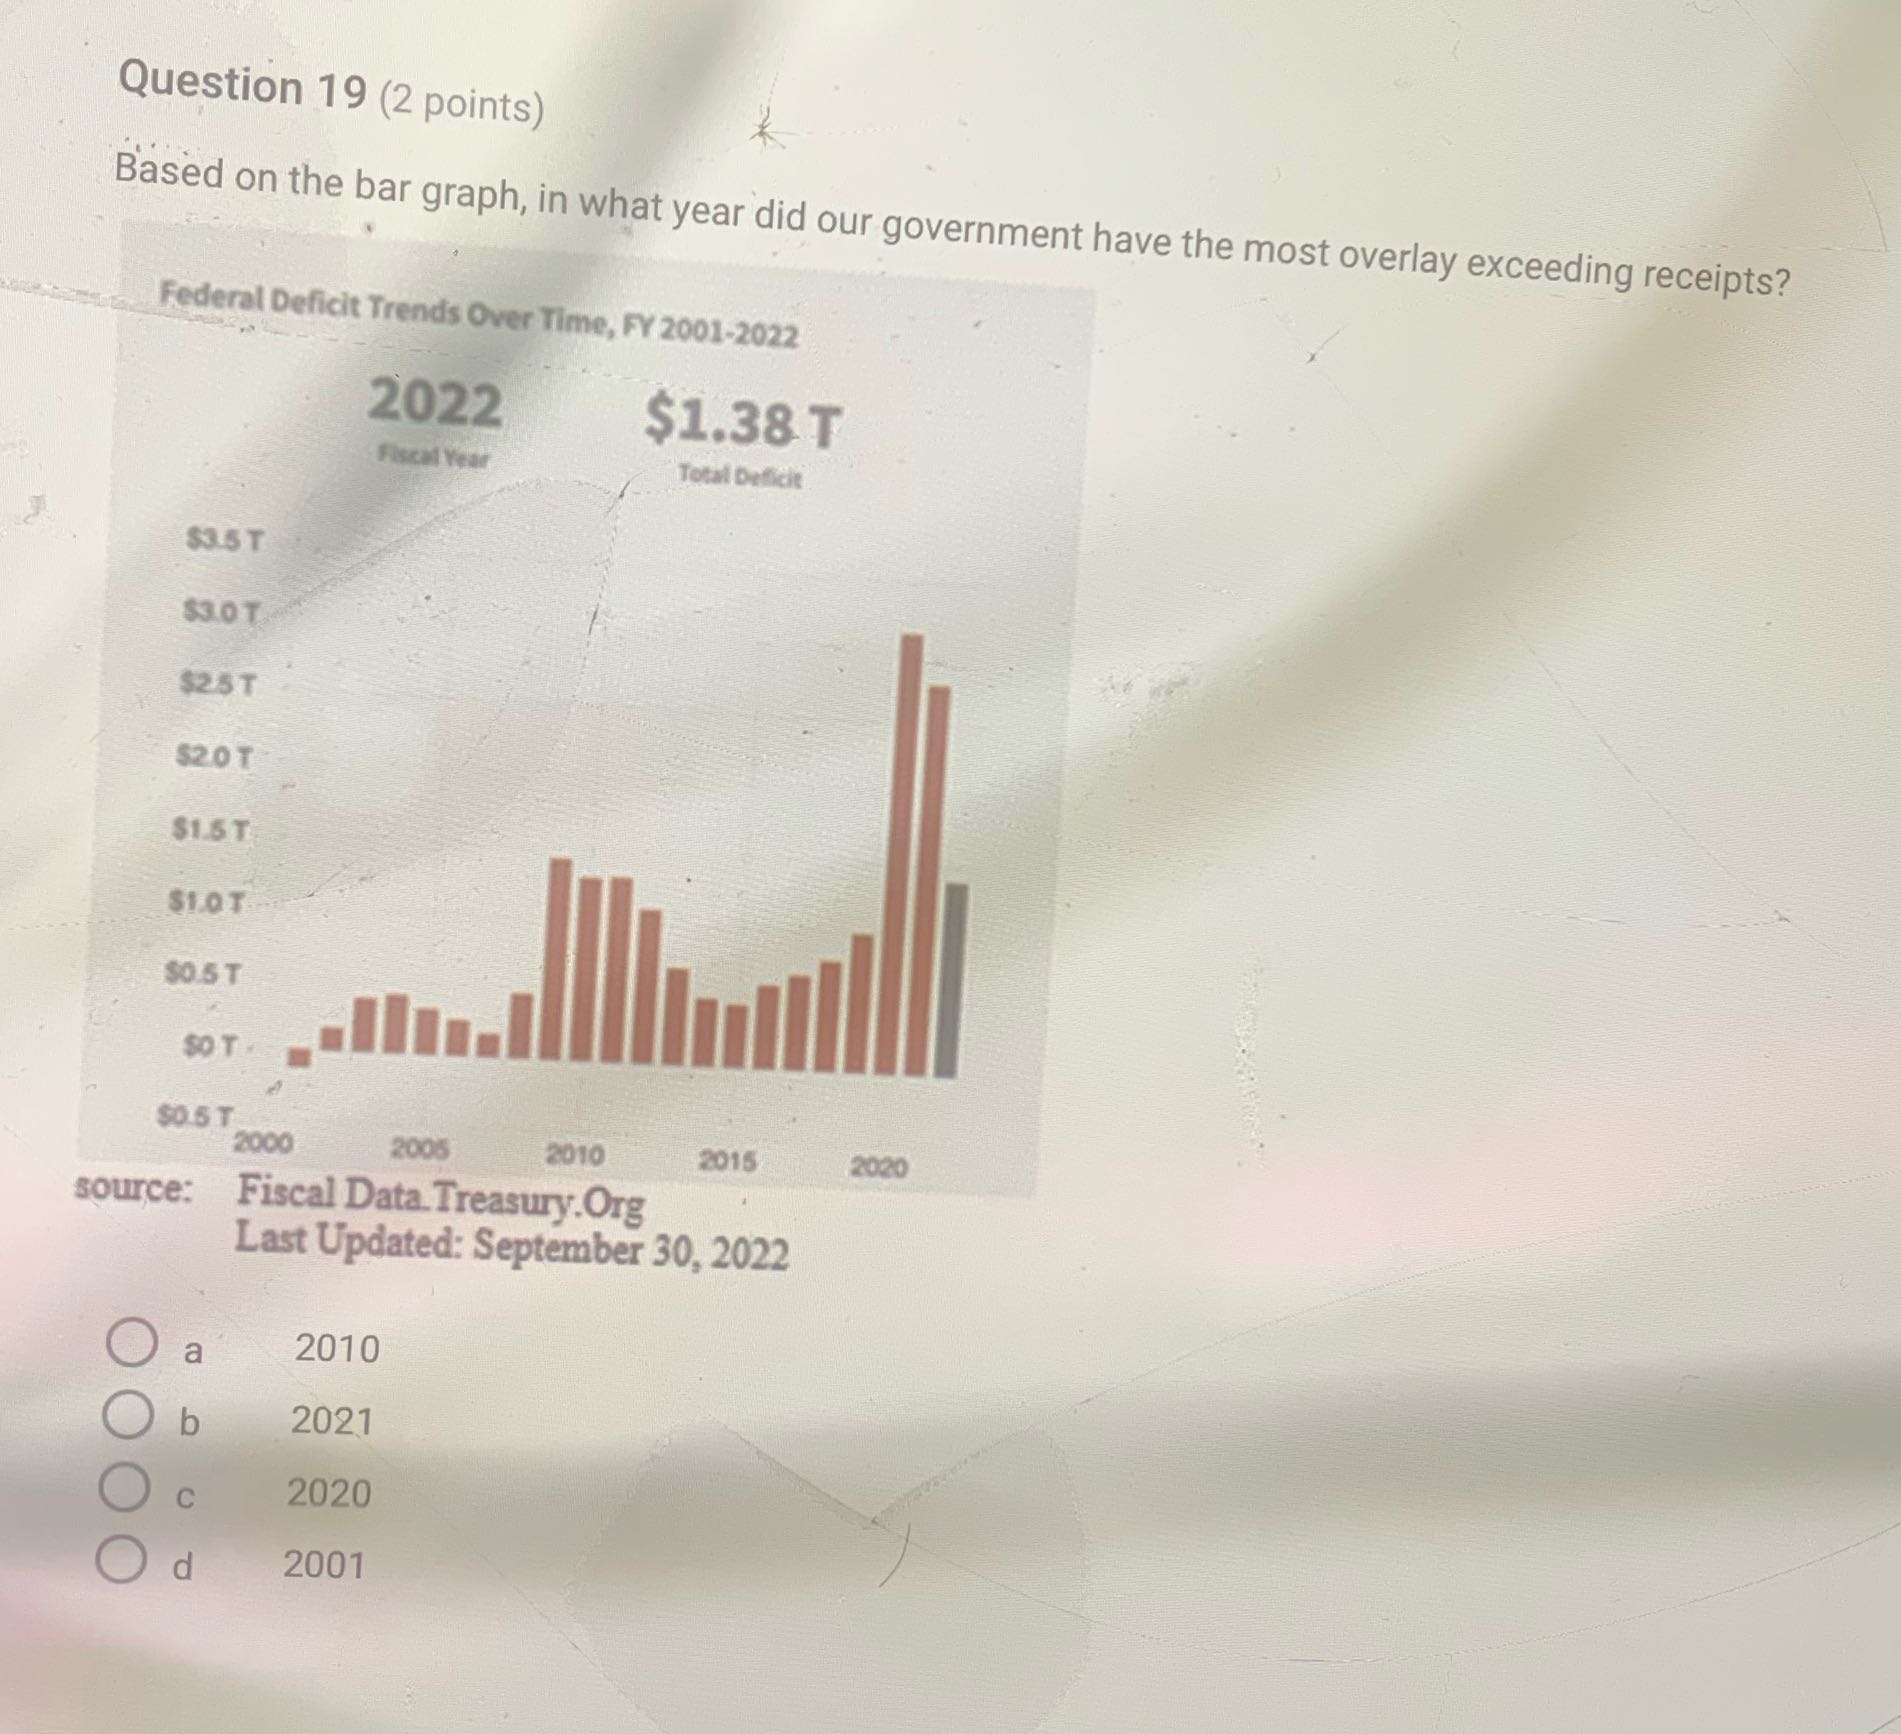
Question: Question 19 (2 points) Based on the bar graph, in what year did our government have the most overlay exceeding receipts? Federal Deficit Trends Over

Question 19 (2 points) Based on the bar graph, in
Question 19 (2 points) Based on the bar graph, in what year did our government have the most overlay exceeding receipts? Federal Deficit Trends Over Time, FY 2001-2022 2022 $1.38 T Fiscal Year Total Deficit $3.5 T $3.0 T $25 T $20 T SO.ST SO T - $05 T 2000 2006 2010 2015 2020 source: Fiscal Data. Treasury.Org Last Updated: September 30, 2022 O a 2010 b 2021 O C 2020 O d 2001

Step by Step Solution

There are 3 Steps involved in it

1 Expert Approved Answer
Step: 1 Unlock blur-text-image
Question Has Been Solved by an Expert!

Get step-by-step solutions from verified subject matter experts

Step: 2 Unlock
Step: 3 Unlock

Students Have Also Explored These Related Accounting Questions!