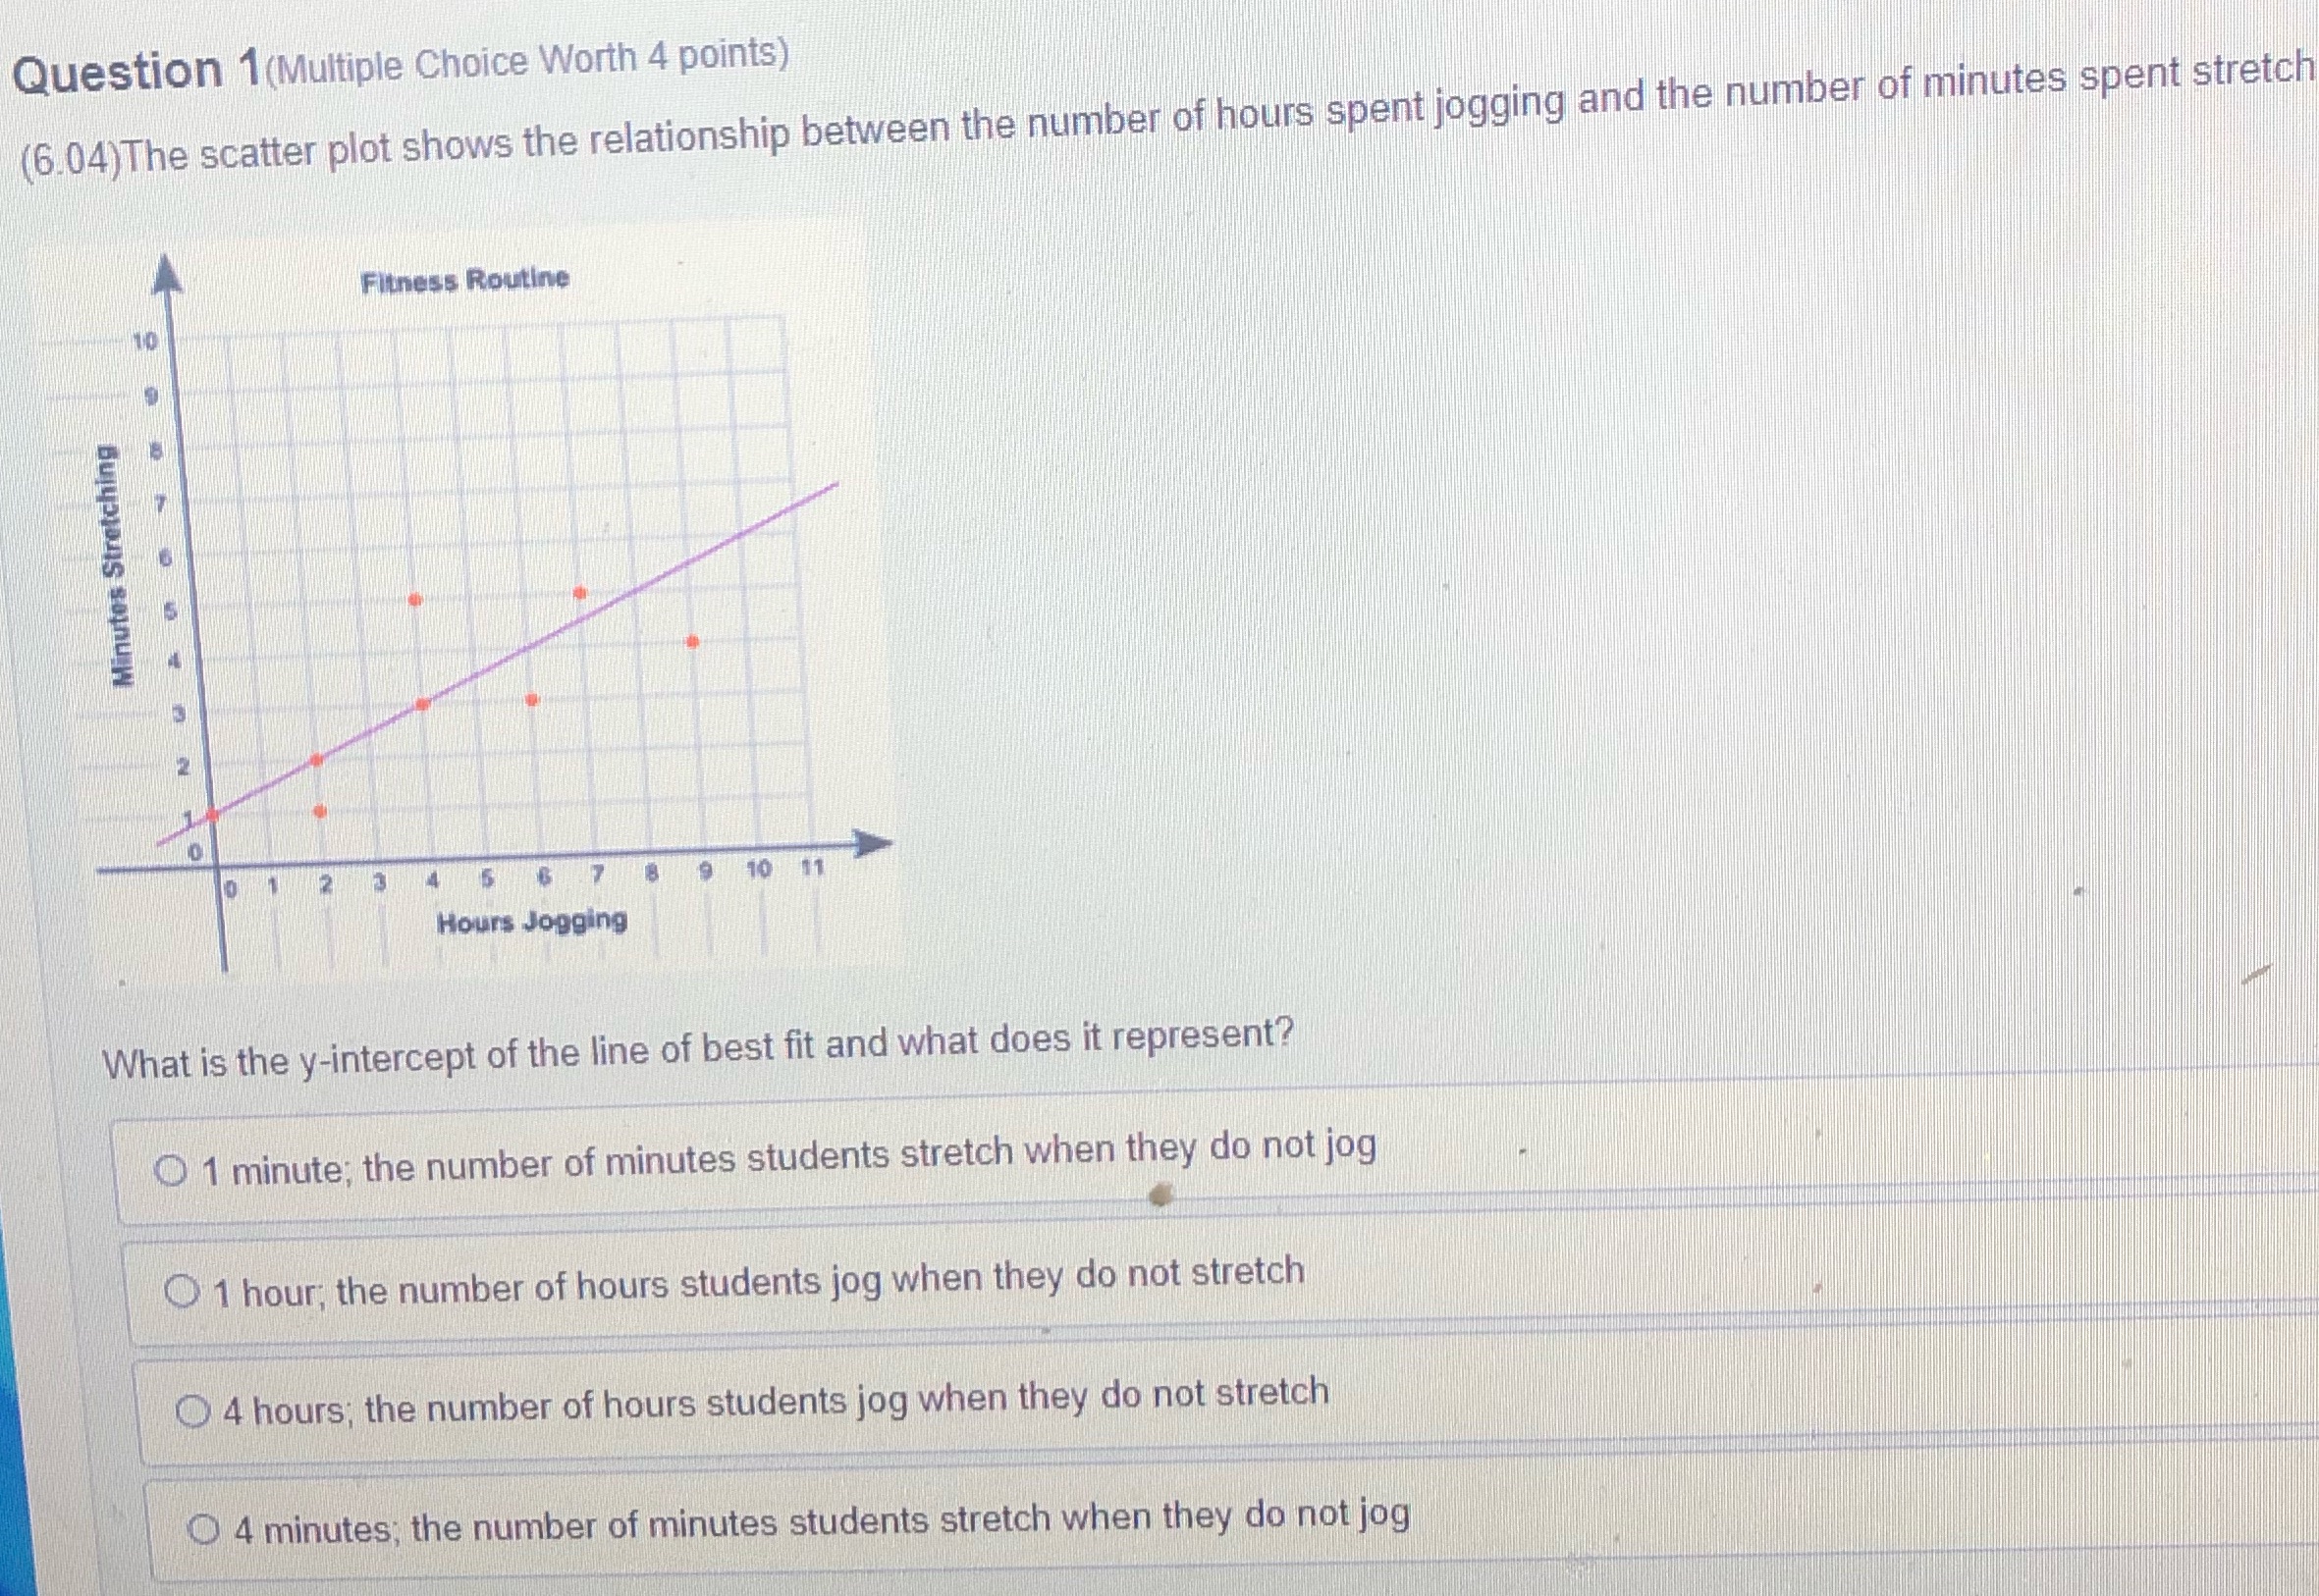
Question: Question 1(Multiple Choice Worth 4 points) (6.04)The scatter plot shows the relationship between the number of hours spent jogging and the number of minutes spent

Question 1(Multiple Choice Worth 4 points)
Question 1(Multiple Choice Worth 4 points) (6.04)The scatter plot shows the relationship between the number of hours spent jogging and the number of minutes spent stretch Fitness Routine Minutes Stretching 13 6 7 8 10 11 Hours Jogging What is the y-intercept of the line of best fit and what does it represent? O 1 minute; the number of minutes students stretch when they do not jog O 1 hour, the number of hours students jog when they do not stretch O 4 hours; the number of hours students jog when they do not stretch 4 minutes; the number of minutes students stretch when they do not jog

Step by Step Solution

There are 3 Steps involved in it

1 Expert Approved Answer
Step: 1 Unlock blur-text-image
Question Has Been Solved by an Expert!

Get step-by-step solutions from verified subject matter experts

Step: 2 Unlock
Step: 3 Unlock

Students Have Also Explored These Related Mathematics Questions!