

Question: Question 2 0.3 pts Refer to the table below (about historical demand for a product) for answering next FOUR questions (i.e. Q2-25). Demand 12 11
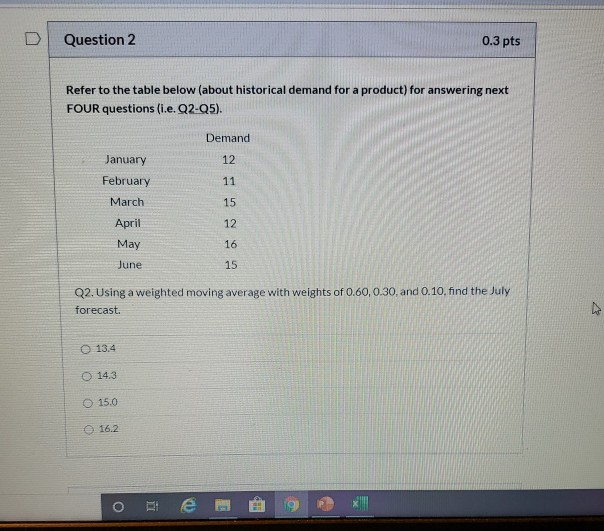
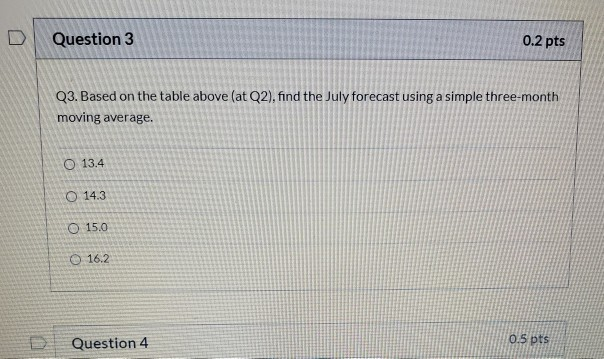
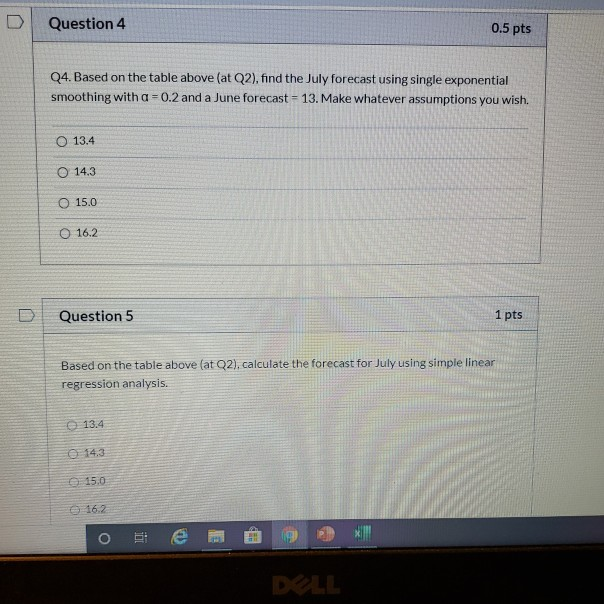
Question 2 0.3 pts Refer to the table below (about historical demand for a product) for answering next FOUR questions (i.e. Q2-25). Demand 12 11 January February March April May 15 12 16 June 15 Q2. Using a weighted moving average with weights of 0.60,0.30, and 0.10, find the July forecast. V 13.4 14.3 O 15.0 o e Question 3 0.2 pts Q3. Based on the table above (at Q2), find the July forecast using a simple three-month moving average. O 13.4 O 14.3 O 15.0 16.2 Question 4 0.5 pts Question 4 0.5 pts Q4. Based on the table above (at Q2), find the July forecast using single exponential smoothing with a =0.2 and a June forecast - 13. Make whatever assumptions you wish. O 13.4 O 14.3 O 15.0 O 16.2 Question 5 1 pts Based on the table above (at Q2), calculate the forecast for July using simple linear regression analysis. e 13.4 15.0 B 16.2 O
Step by Step Solution
There are 3 Steps involved in it
1 Expert Approved Answer
Step: 1 Unlock

Question Has Been Solved by an Expert!
Get step-by-step solutions from verified subject matter experts
Step: 2 Unlock
Step: 3 Unlock