

Question: Question 2 ( 1 point ) Based on the rules for isometric scaling discussed in lecture, which of the log - log graphs best represents
Question point
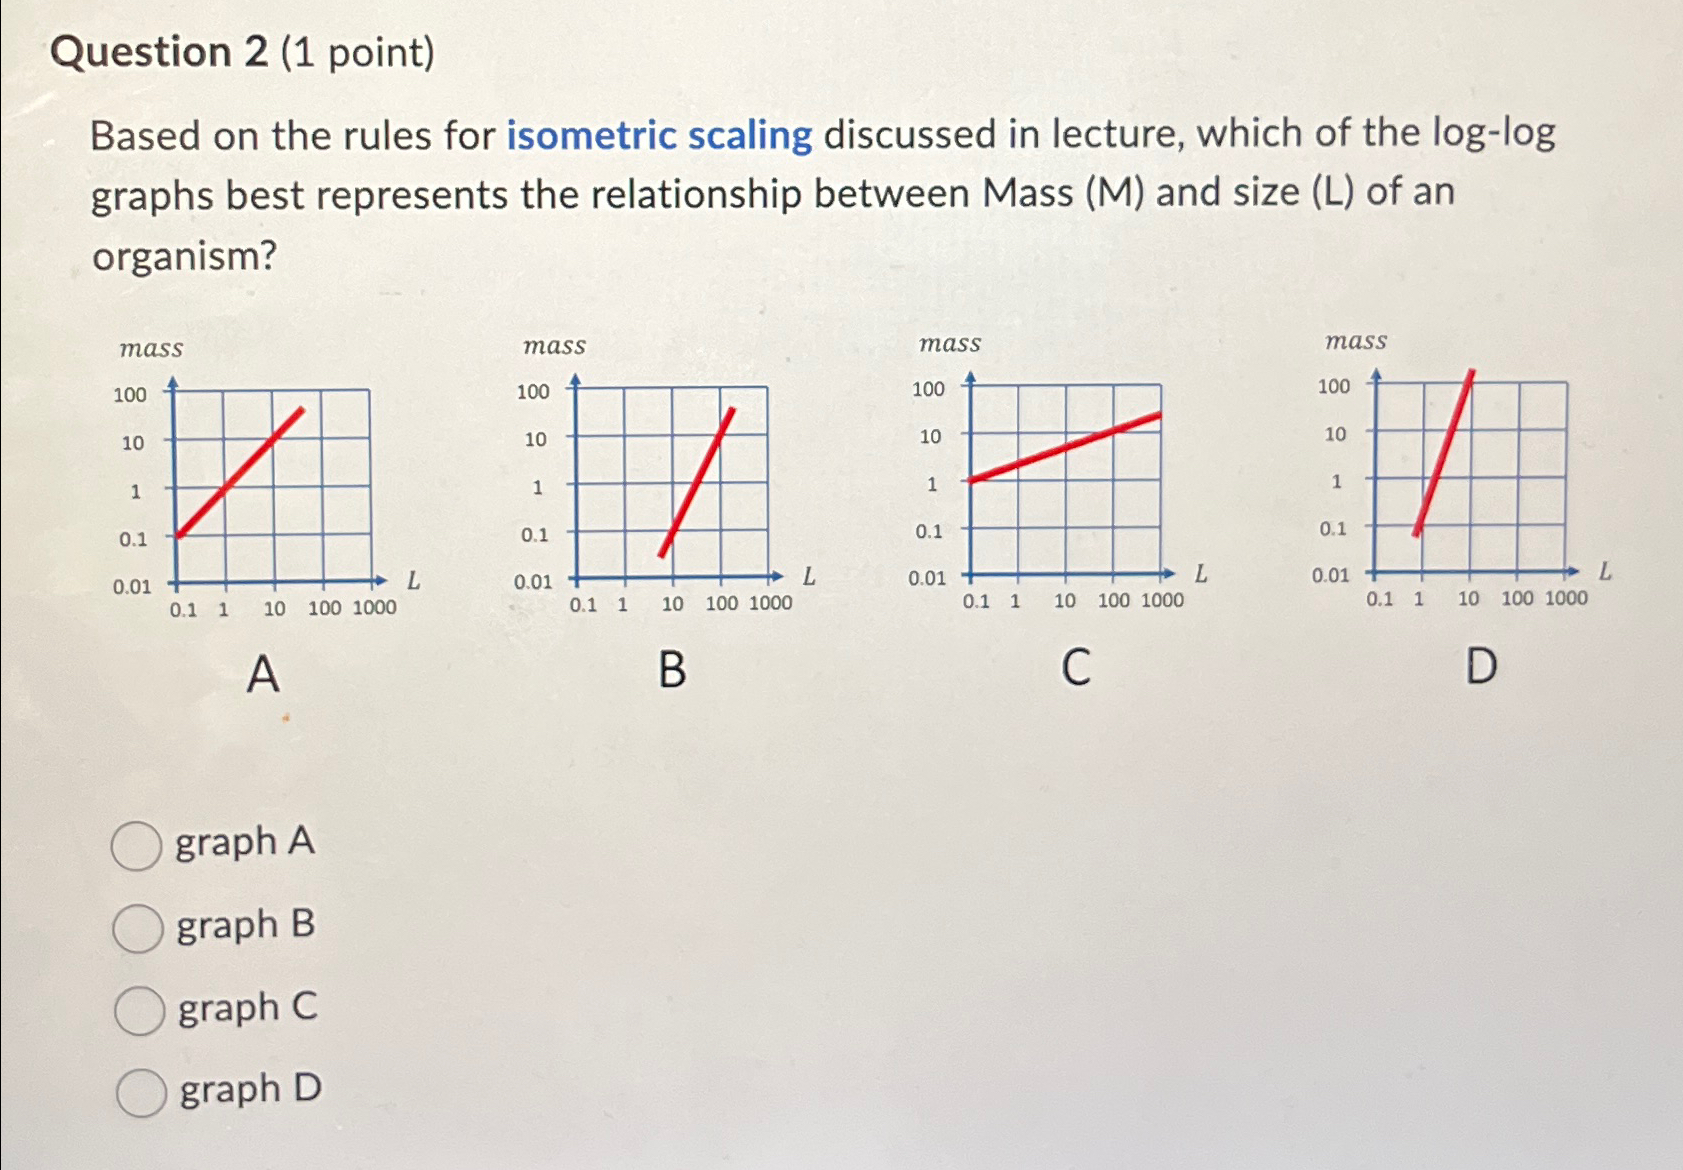
Based on the rules for isometric scaling discussed in lecture, which of the loglog graphs best represents the relationship between Mass M and size L of an organism?
B
C
D
graph A
graph B
graph C
graph D
Step by Step Solution
There are 3 Steps involved in it
1 Expert Approved Answer
Step: 1 Unlock

Question Has Been Solved by an Expert!
Get step-by-step solutions from verified subject matter experts
Step: 2 Unlock
Step: 3 Unlock