

Question: Question 2 (1 point) Exhibit 15-16 Below you are given a partial Excel output based on a sample of 8 observations. ANOVA df SS MS
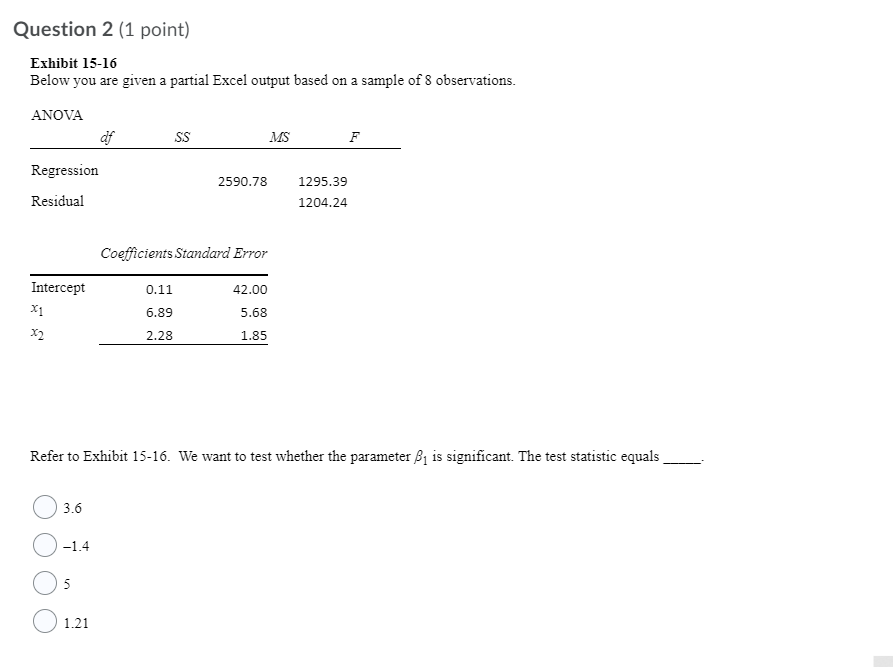
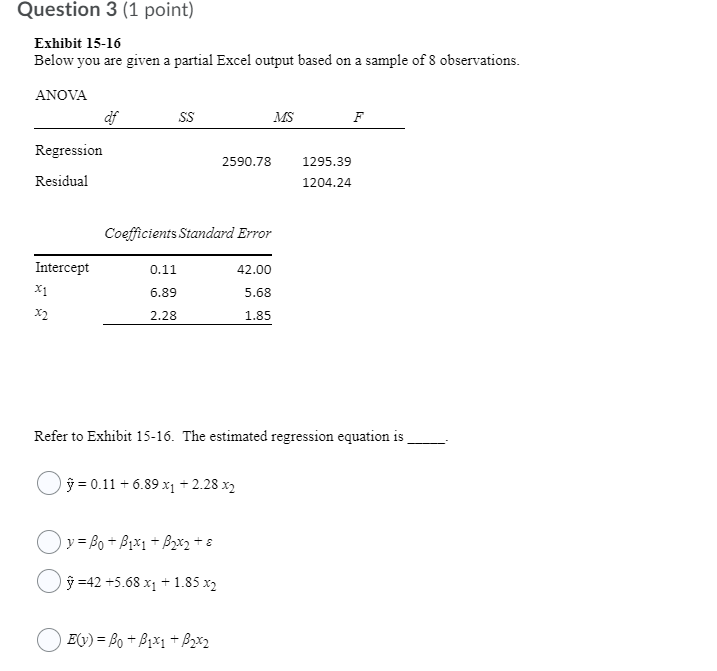
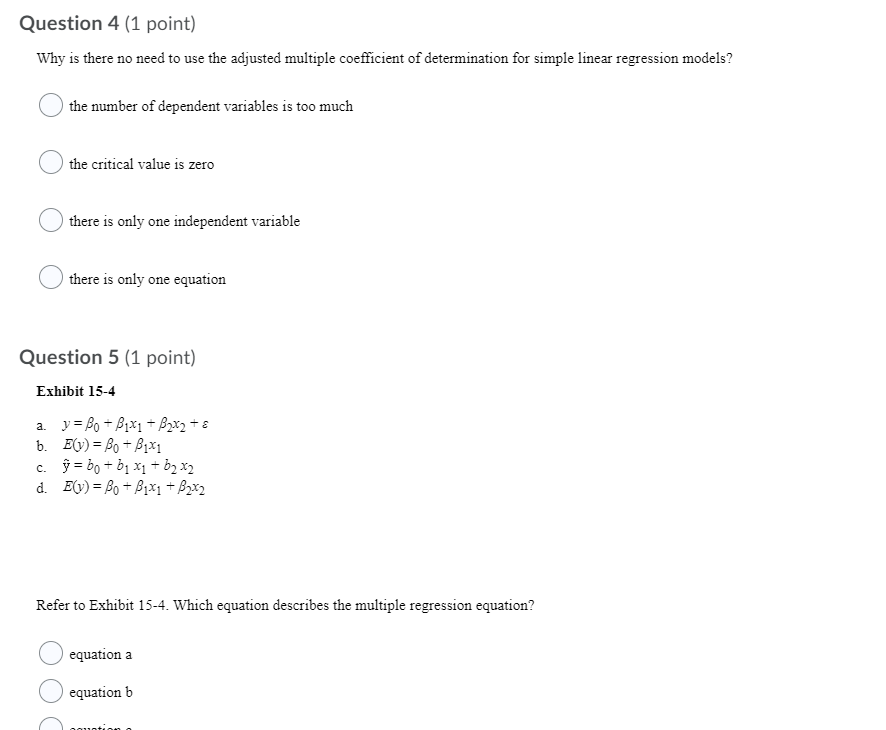
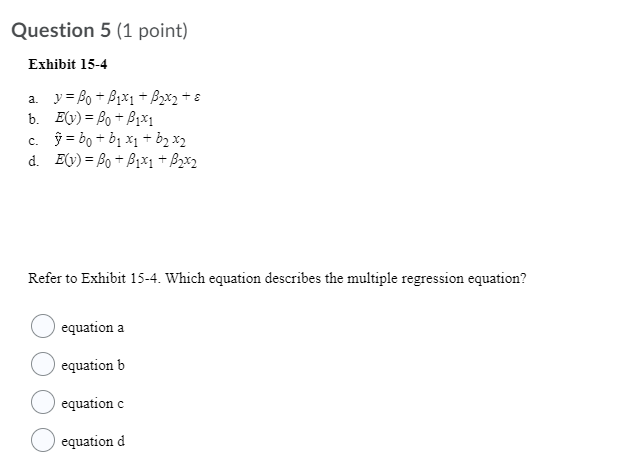
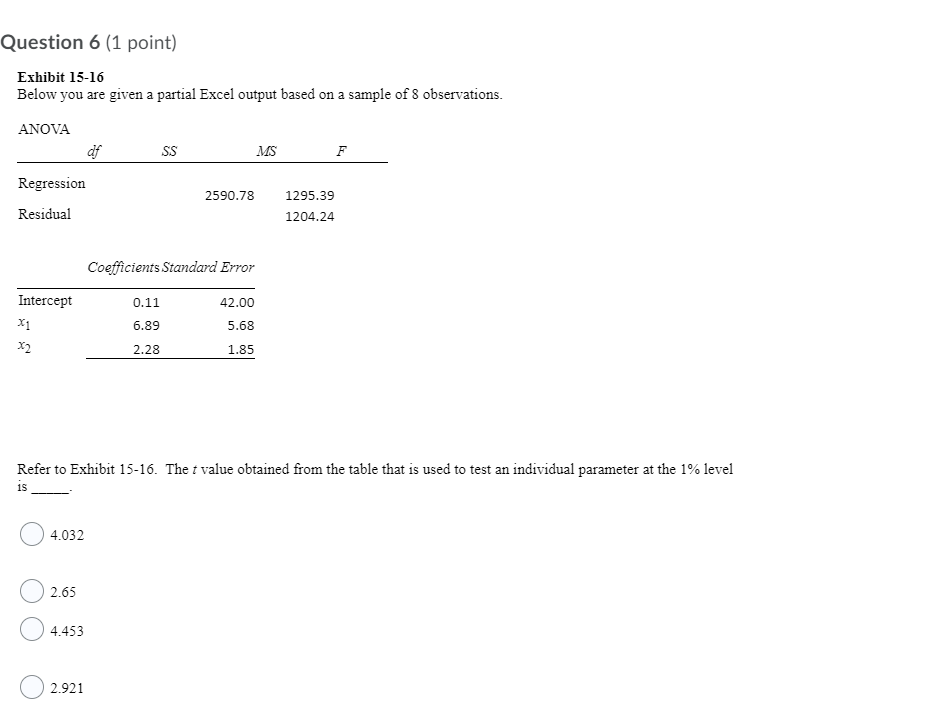
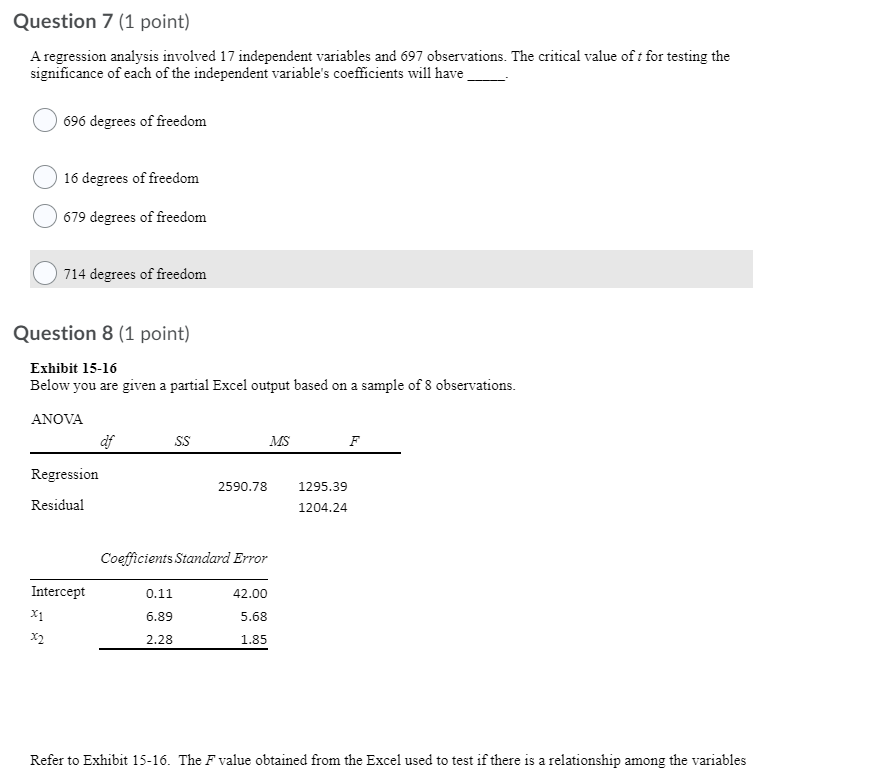
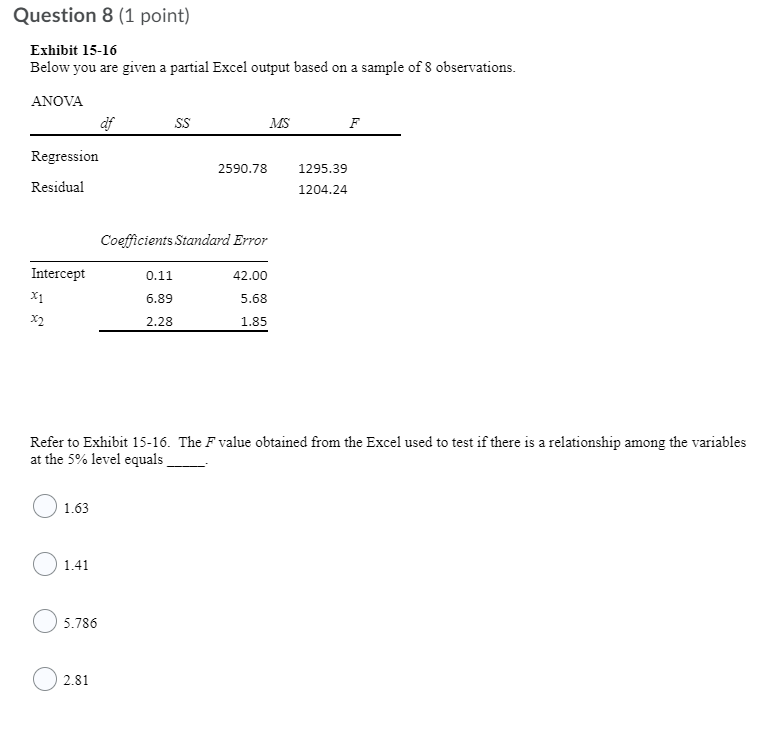
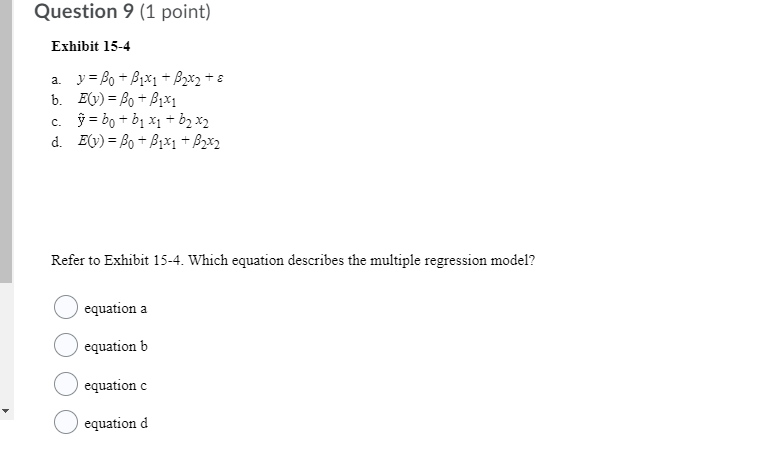
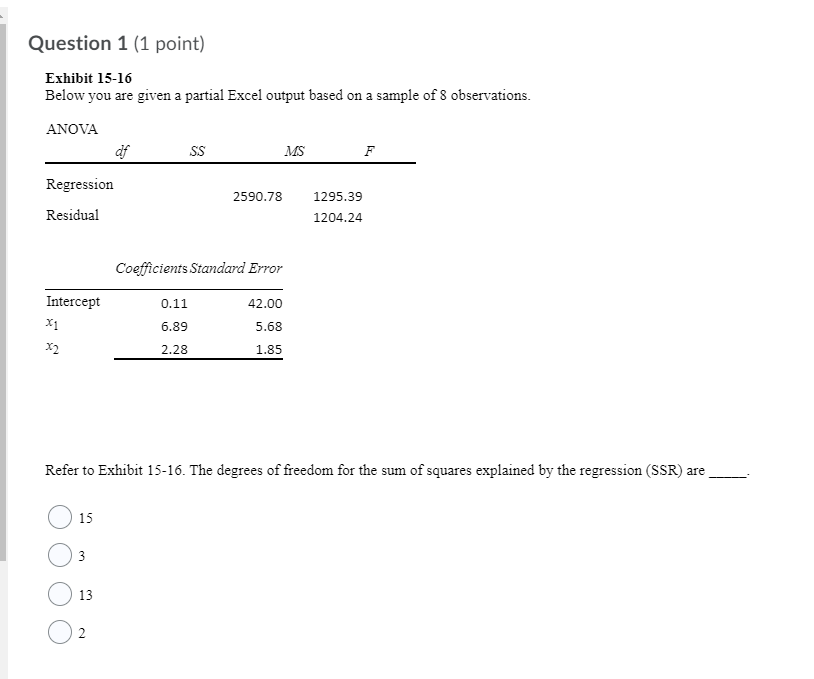
Question 2 (1 point) Exhibit 15-16 Below you are given a partial Excel output based on a sample of 8 observations. ANOVA df SS MS F Regression 2590.78 1295.39 Residual 1204.24 Coefficients Standard Error Intercept 0.11 42.00 6.89 5.68 2.28 1.85 Refer to Exhibit 15-16. We want to test whether the parameter , is significant. The test statistic equals 3.6 -1.4 5 1.21Question 3 (1 point) Exhibit 15-16 Below you are given a partial Excel output based on a sample of 8 observations. ANOVA df SS MS F Regression 2590.78 1295.39 Residual 1204.24 Coefficients Standard Error Intercept 0.11 42.00 X1 6.89 5.68 2.28 1.85 Refer to Exhibit 15-16. The estimated regression equation is Of=0.11 +6.89 x1 + 2.28 x2 Oy = Bo + Byx] + Byxy + e (9=42+5.68 x1 + 1.85 x2 ( E(V) = Bo + Pixi + 82x2Question 4 (1 point) Why is there no need to use the adjusted multiple coefficient of determination for simple linear regression models? the number of dependent variables is too much the critical value is zero there is only one independent variable O there is only one equation Question 5 (1 point) Exhibit 15-4 a. y = Bo + Bix1 + Byxz + e b. E(v) = Bo + 81x1 c. y = bo+ b1 x1 + b2 x2 d. E(v) = Bo + Bix1 + 82x2 Refer to Exhibit 15-4. Which equation describes the multiple regression equation? O equation a O equation bQuestion 5 (1 point) Exhibit 15-4 a. y = Bo + Bix1 + Byxz + e b. E(y) = Bo + Bix1 c. y= bo+ bj x1 + byx2 d. E(y) = Bo + Bix1 + 82x2 Refer to Exhibit 15-4. Which equation describes the multiple regression equation? O equation a equation b O equation c O equation dQuestion 6 (1 point) Exhibit 15-16 Below you are given a partial Excel output based on a sample of 8 observations. ANOVA df SS MS F Regression 2590.78 1295.39 Residual 1204.24 Coefficients Standard Error Intercept 0.11 42.00 6.89 5.68 2.28 1.85 Refer to Exhibit 15-16. The : value obtained from the table that is used to test an individual parameter at the 1% level 1S 4.032 2.65 4.453 2.921Question 7 (1 point) A regression analysis involved 17 independent variables and 697 observations. The critical value of : for testing the significance of each of the independent variable's coefficients will have O 696 degrees of freedom 16 degrees of freedom O 679 degrees of freedom O 714 degrees of freedom Question 8 (1 point) Exhibit 15-16 Below you are given a partial Excel output based on a sample of 8 observations. ANOVA df SS MS F Regression 2590.78 1295.39 Residual 1204.24 Coefficients Standard Error Intercept 0.11 42.00 X1 6.89 5.68 2.28 1.85 Refer to Exhibit 15-16. The F value obtained from the Excel used to test if there is a relationship among the variablesQuestion 8 (1 point) Exhibit 15-16 Below you are given a partial Excel output based on a sample of 8 observations. ANOVA df SS MS F Regression 2590.78 1295.39 Residual 1204.24 Coefficients Standard Error Intercept 0.11 42.00 X1 6.89 5.68 2.28 1.85 Refer to Exhibit 15-16. The F value obtained from the Excel used to test if there is a relationship among the variables at the 5% level equals 1.63 1.41 O 5.786 2.81Question 9 (1 point) Exhibit 15-4 a. y = Bo + Bix1 + B2xz + e b. E(v) = Bo + B1x1 c. y= bo+ bj x1 + b2x2 d. E(y) = Bo + Bix1 + 82x2 Refer to Exhibit 15-4. Which equation describes the multiple regression model? O equation a O equation b O equation c O equation dQuestion 1 (1 point) Exhibit 15-16 Below you are given a partial Excel output based on a sample of $ observations. ANOVA df SS MS F Regression 2590.78 1295.39 Residual 1204.24 Coefficients Standard Error Intercept 0.11 42.00 X1 6.89 5.68 2.28 1.85 Refer to Exhibit 15-16. The degrees of freedom for the sum of squares explained by the regression (SSR) are O 3 O 13 O
Step by Step Solution
There are 3 Steps involved in it

Get step-by-step solutions from verified subject matter experts