

Question: Question 2 (12 marks) The following table provides macroeconomic data from 2009-2015 for a hypothetical economy. Dollar amounts are all in constant-dollar terms. Actual Output
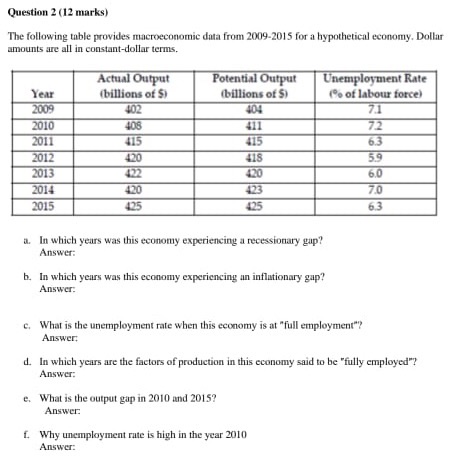
Question 2 (12 marks) The following table provides macroeconomic data from 2009-2015 for a hypothetical economy. Dollar amounts are all in constant-dollar terms. Actual Output Potential Output Unemployment Rate Year (billions of $) (billions of $) ( of labour force) 2009 402 404 7.1 2010 408 411 7.2 2011 415 415 6.3 2012 420 418 59 2013 472 420 6.0 2014 420 423 7.0 2015 425 6.3 a. In which years was this economy experiencing a recessionary gap? Answer: b. In which years was this economy experiencing an inflationary gap? Answer: c. What is the unemployment rate when this economy is at "full employment"? Answer d. In which years are the factors of production in this economy said to be "fully employed"? Answer: e. What is the output gap in 2010 and 2015? Answer f. Why unemployment rate is high in the year 2010
Step by Step Solution
There are 3 Steps involved in it

Get step-by-step solutions from verified subject matter experts