

Question: QUESTION #2: 12 pts The graph below shows the demand curve (D), marginal revenue curve (MR), marginal cost curve (MC), average total cost curve (ATC),
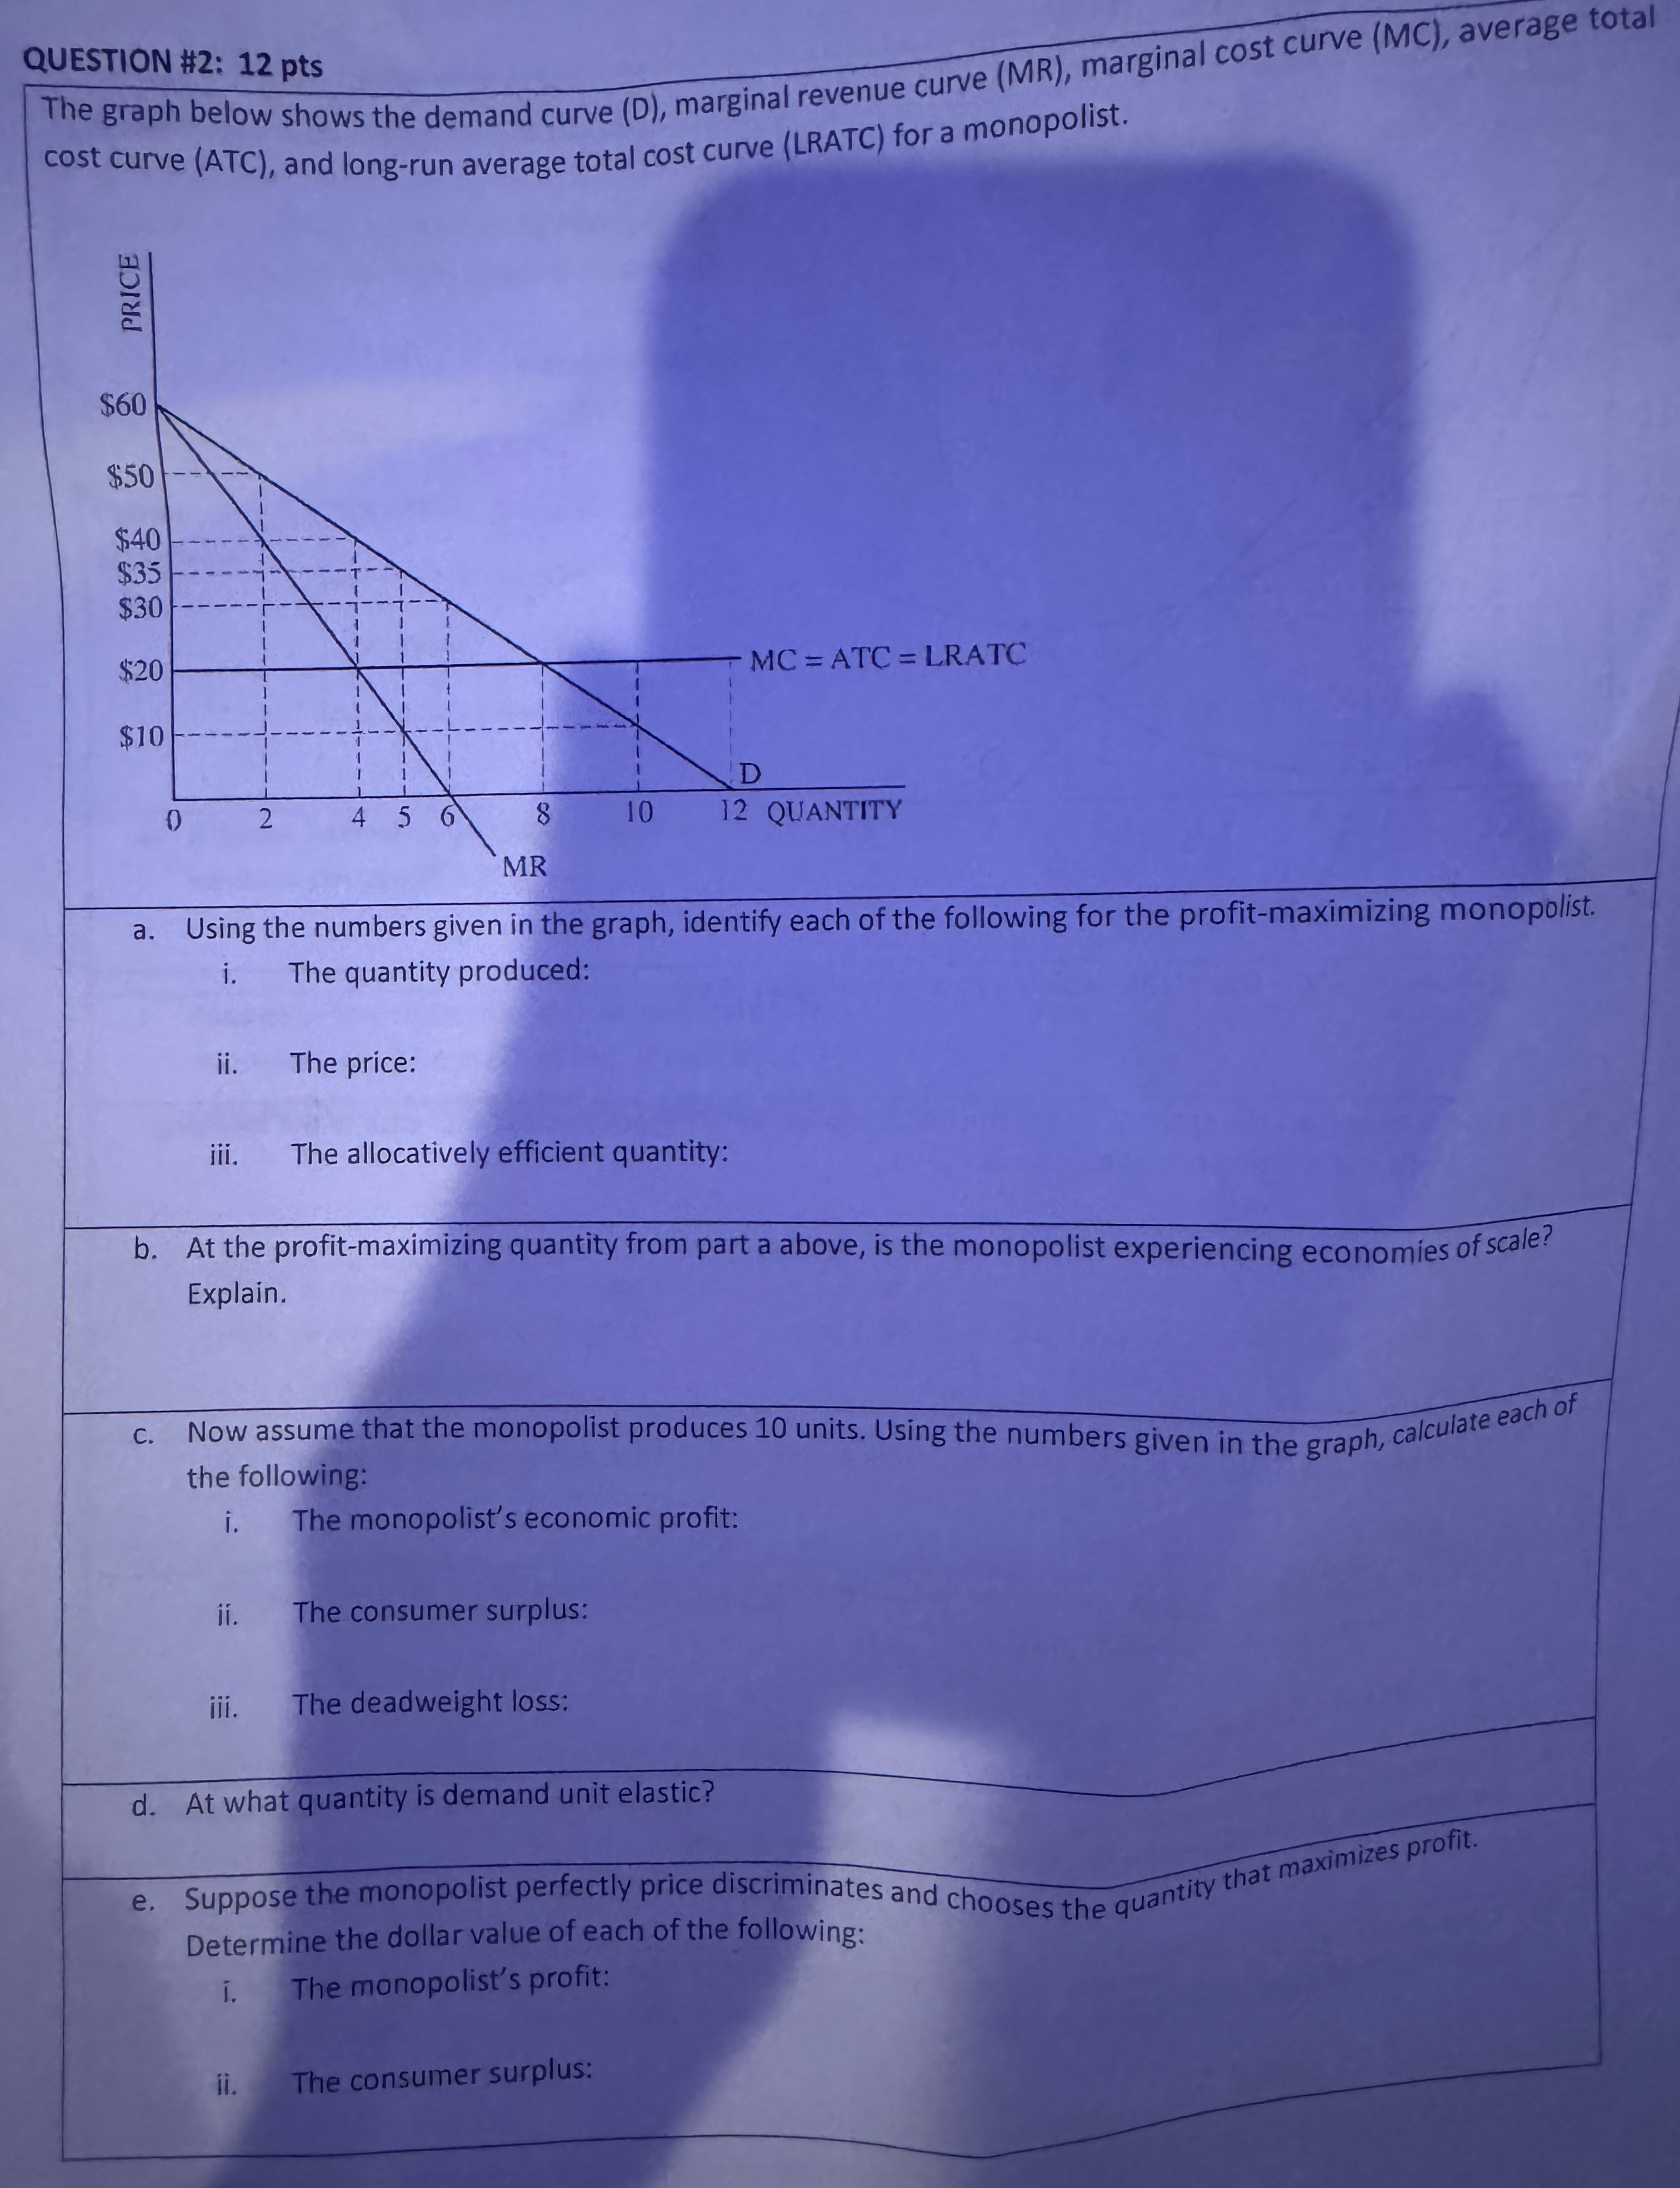
QUESTION #2: 12 pts The graph below shows the demand curve (D), marginal revenue curve (MR), marginal cost curve (MC), average total cost curve (ATC), and long-run average total cost curve (LRATC) for a monopolist. PRICE $60 $50 $40 $35 $30 $20 MC = ATC =LRATC $10 D 6 10 12 QUANTITY MR a. Using the numbers given in the graph, identify each of the following for the profit-maximizing monopolist. i. The quantity produced: ii. The price: iii. The allocatingly efficient quantity: b. At the profit-maximizing quantity from part a above, is the monopolist experiencing economies of scale? Explain. c. Now assume that the monopolist produces 10 units. Using the numbers given in the graph, calculate eachor the following: i. The monopolist's economic profit: ii. The consumer surplus: iii. The deadweight loss: d. At what quantity is demand unit elastic? e . Suppose the monopolist perfectly price discriminates and choose thuantity that maximizes prom Determine the dollar value of each of the following: i. The monopolist's profit: ii. The consumer surplus
Step by Step Solution
There are 3 Steps involved in it

Get step-by-step solutions from verified subject matter experts