

Question: Question 2. (15 pts) Datacrackers, Inc., generated preliminary data from a clients process as found in Prob04-05 in spreadsheet HW3 Dataset .xlsx . Must use
Question 2. (15 pts) Datacrackers, Inc., generated preliminary data from a clients process as found in Prob04-05 in spreadsheet HW3 Dataset.xlsx . Must use Minitab for both parts, a and b.
a. Apply the Excel Descriptive Statistics tool to compute the mean, standard deviation, and other relevant statistics, and interpret the results in a meaningful fashion.
b. Use the Frequency Distribution and Histogram Excel template to construct a frequency distribution and histogram for the data. From what type of distribution might you suspect the data are drawn? Experiment with the number of cells to create a visually-appealing histogram and use the Excel Histogram tool to verify the results. Interpret your results from parts a and b for managerial purposes.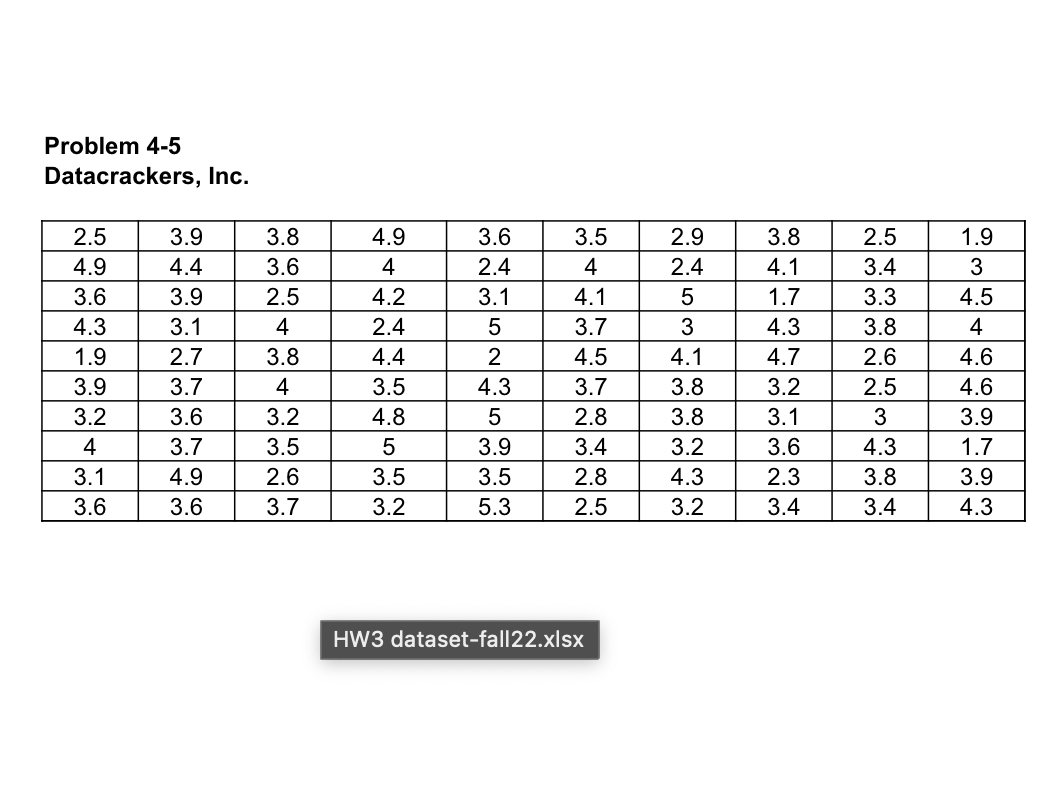
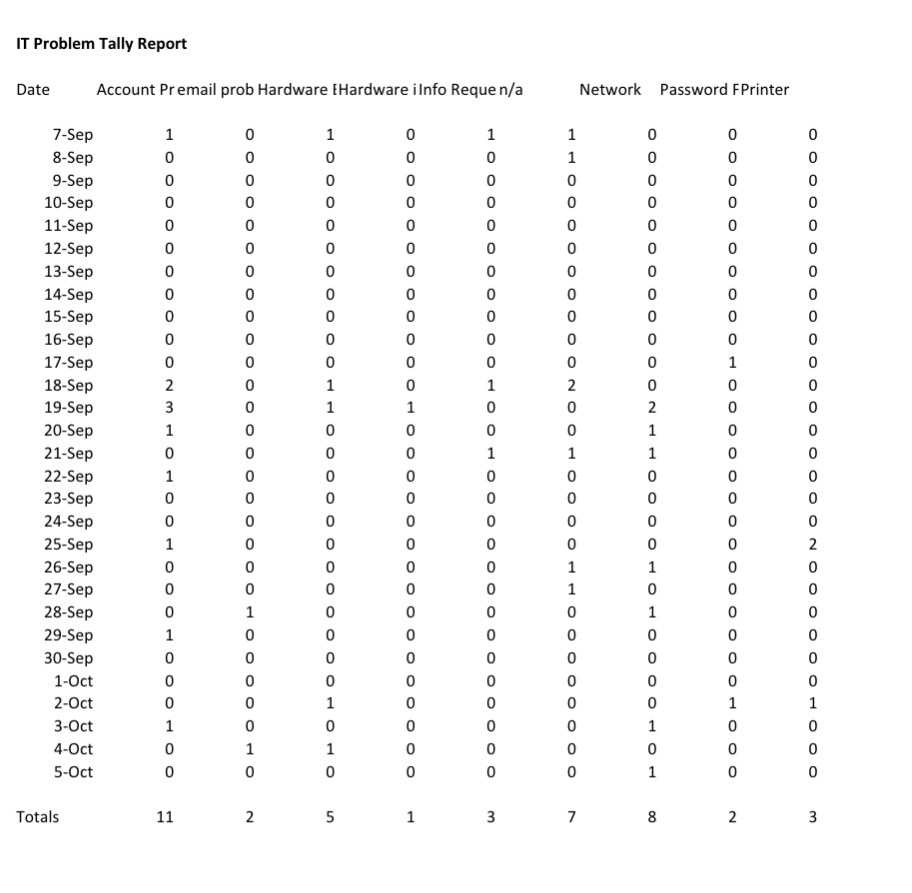
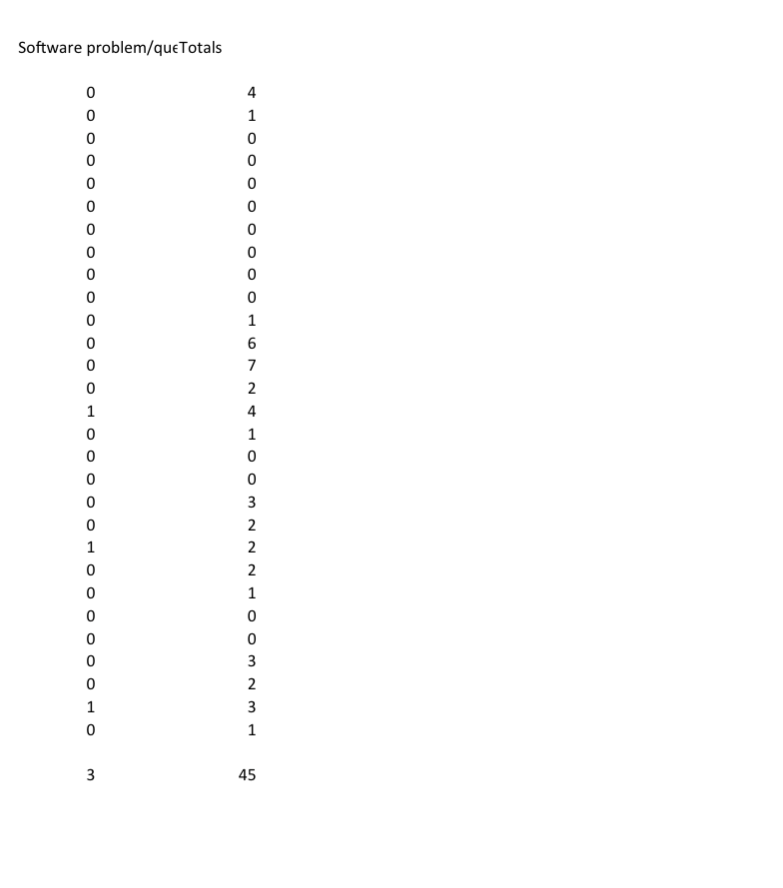
Problem 4-5 Datacrackers, Inc. IT Problem Tally Report Software problem/qu 1 Totals 3 45
Step by Step Solution
There are 3 Steps involved in it

Get step-by-step solutions from verified subject matter experts