

Question: Question 2 [18 points] The following table shows labour force figures in the European Union (EU-27) in the years from 2007 to 2011. Number Number
![Question 2 [18 points] The following table shows labour force figures](https://s3.amazonaws.com/si.experts.images/answers/2024/06/668077ffb62d4_359668077ff9befb.jpg)
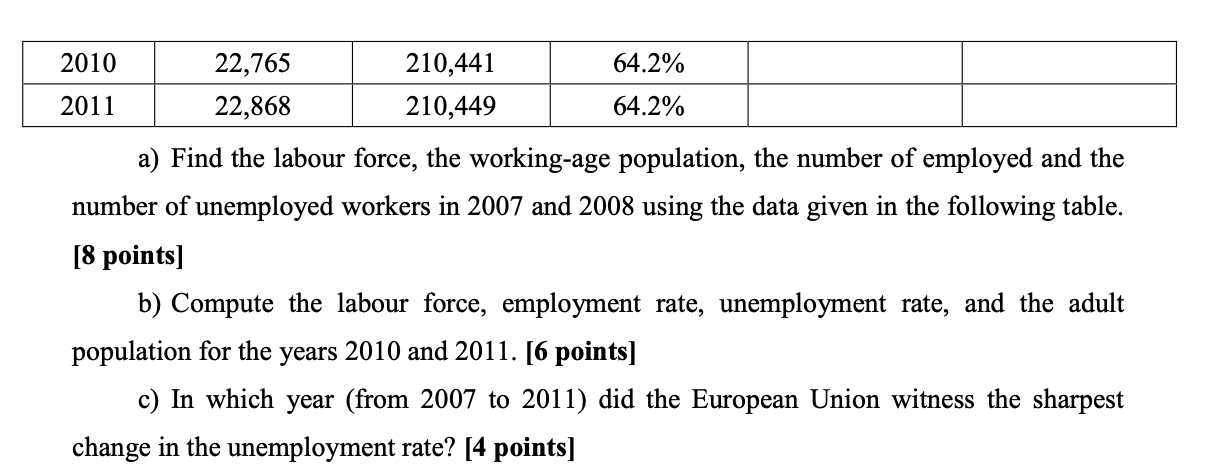
Question 2 [18 points] The following table shows labour force figures in the European Union (EU-27) in the years from 2007 to 2011. Number Number Labor Force Unemployment Not in the labor Unemployed Employed (in Participation Rate force Year (in thousands) thousands) Rate (in thousands) 2007 65.30% 7.20% 123,106 121,510 2008 65.80% 7.10% 64.50% 9.00% 129,040 20092010 22,765 210,441 64.2% 2011 22,868 210,449 64.2% a) Find the labour force, the working-age population, the number of employed and the number of unemployed workers in 2007 and 2008 using the data given in the following table. [8 points] b) Compute the labour force, employment rate, unemployment rate, and the adult population for the years 2010 and 2011. [6 points] 0) In which year (from 2007 to 2011) did the European Union witness the sharpest change in the unemployment rate? [4 points]
Step by Step Solution
There are 3 Steps involved in it

Get step-by-step solutions from verified subject matter experts