

Question: Question 2 1pt 5 1 0 Details 5 6 7 8 9 10 11 12 13 14 15 16 17 18 19 data Q For
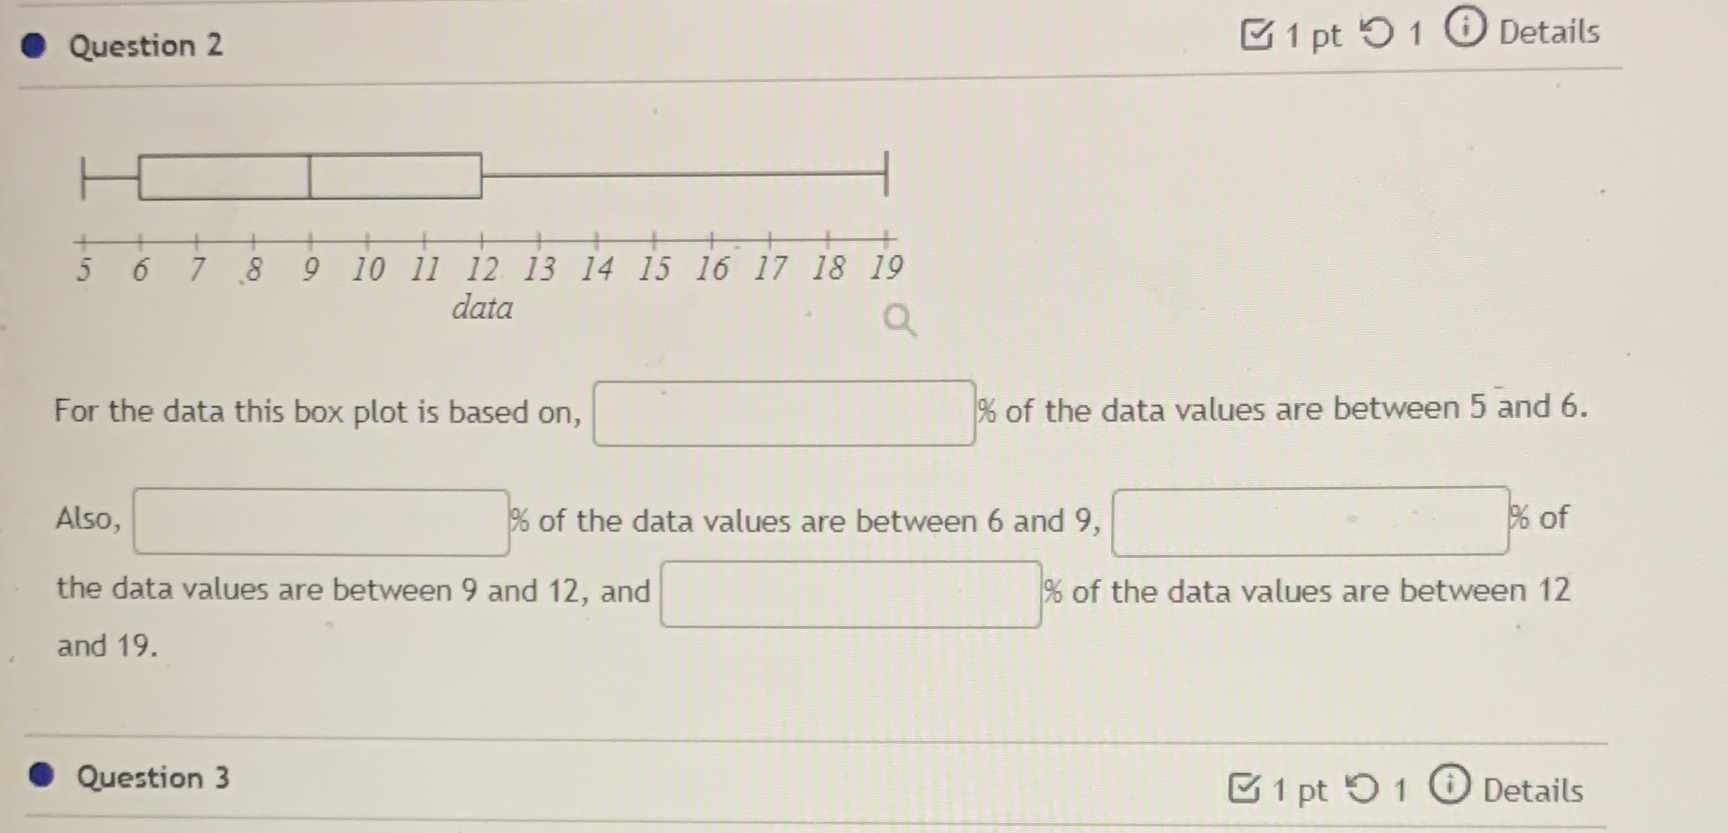
Question 2 1pt 5 1 0 Details 5 6 7 8 9 10 11 12 13 14 15 16 17 18 19 data Q For the data this box plot is based on, % of the data values are between 5 and 6. Also, % of the data values are between 6 and 9, 6 of the data values are between 9 and 12, and % of the data values are between 12 and 19. Question 3 1 pt 5 1 0 Details
Step by Step Solution
There are 3 Steps involved in it
1 Expert Approved Answer
Step: 1 Unlock

Question Has Been Solved by an Expert!
Get step-by-step solutions from verified subject matter experts
Step: 2 Unlock
Step: 3 Unlock