

Question: Question 2 ( 2 5 points ) This assignment will use Transit Monthly Data.xlsx , the number of transit rides on a transportation system from
Question points
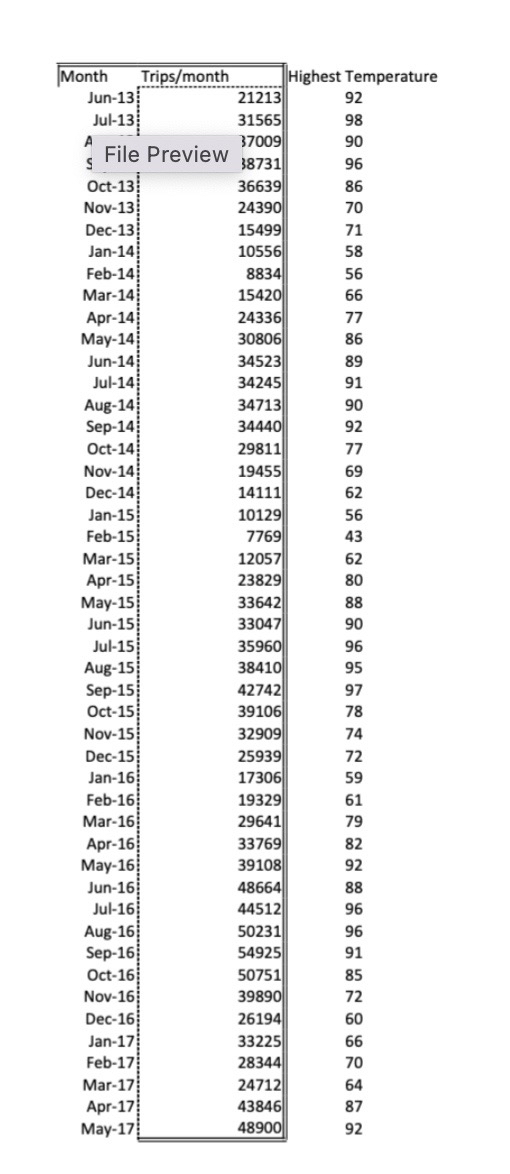
This assignment will use Transit Monthly Data.xlsx the number of transit rides on a transportation system from June up until May Our goal is to build a regression model to predict the ride volume for the following months.
Model A:
a pts Does a linear trend appear to fit these data well? Explain why or why not. Reference any tablesfigures that you need to make your point.
b pts Is there evidence of some seasonal pattern in the sales data? If so characterize the seasonal pattern monthly quarterly, or yearly
c pts Build a regression model withwithout trend no trend, linear or nonlinear trend, depending on your answer in part a and withwithout seasonality depending on your answer in part b To validate your model, use the last months as a validation data set.
I. Copy and paste your code and display the regression output.
II What are the RMSE and MAPE of your model based on the validation data? Discuss the overall performance of you model.
III. Fill in the table with your predictions for the following months.
Note: If it is not clear if the data has trend and seasonality, build models with trend andor seasonality and compare them.
tableMonthYear,tableTripsmonthPredictionJunJulAugSepOctNovDecJanFebMarMay
tableMonth TripsmonthHighest Temperature
Step by Step Solution
There are 3 Steps involved in it
1 Expert Approved Answer
Step: 1 Unlock

Question Has Been Solved by an Expert!
Get step-by-step solutions from verified subject matter experts
Step: 2 Unlock
Step: 3 Unlock