

Question: Question 2 2) The below data comes from the number of hours per week spent on social media for the in-class randomized controlled trial we
Question 2
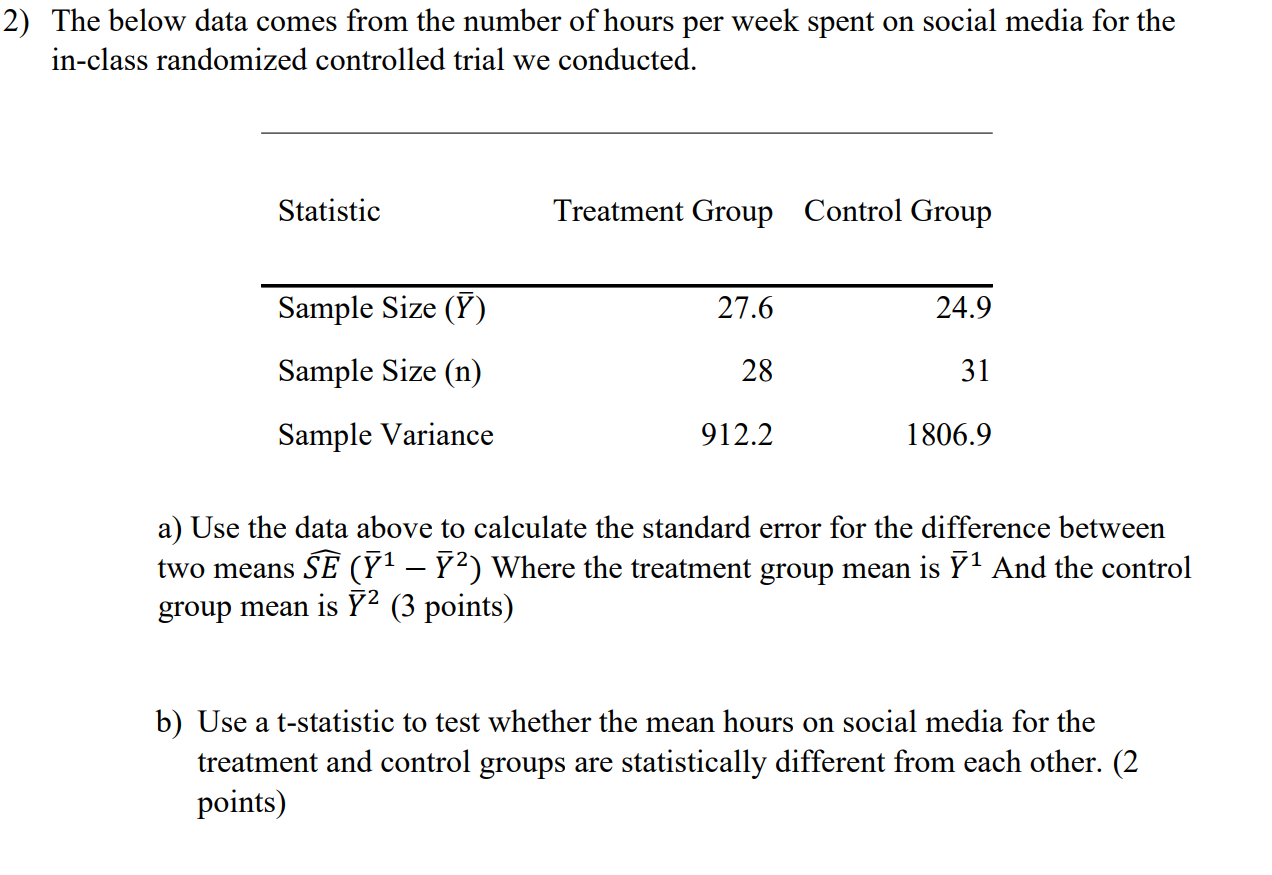
2) The below data comes from the number of hours per week spent on social media for the in-class randomized controlled trial we conducted. Statistic Treatment Group Control Group Sample Size (17) 27.6 24.9 Sample Size (n) 28 31 Sample Variance 912.2 1806.9 a) Use the data above to calculate the standard error for the difference between two means .572? G71 72) Where the treatment group mean is 71 And the control group mean is 72 (3 points) b) Use a t-statistic to test whether the mean hours on social media for the treatment and control groups are statistically different from each other. (2 points)
Step by Step Solution
There are 3 Steps involved in it
1 Expert Approved Answer
Step: 1 Unlock

Question Has Been Solved by an Expert!
Get step-by-step solutions from verified subject matter experts
Step: 2 Unlock
Step: 3 Unlock