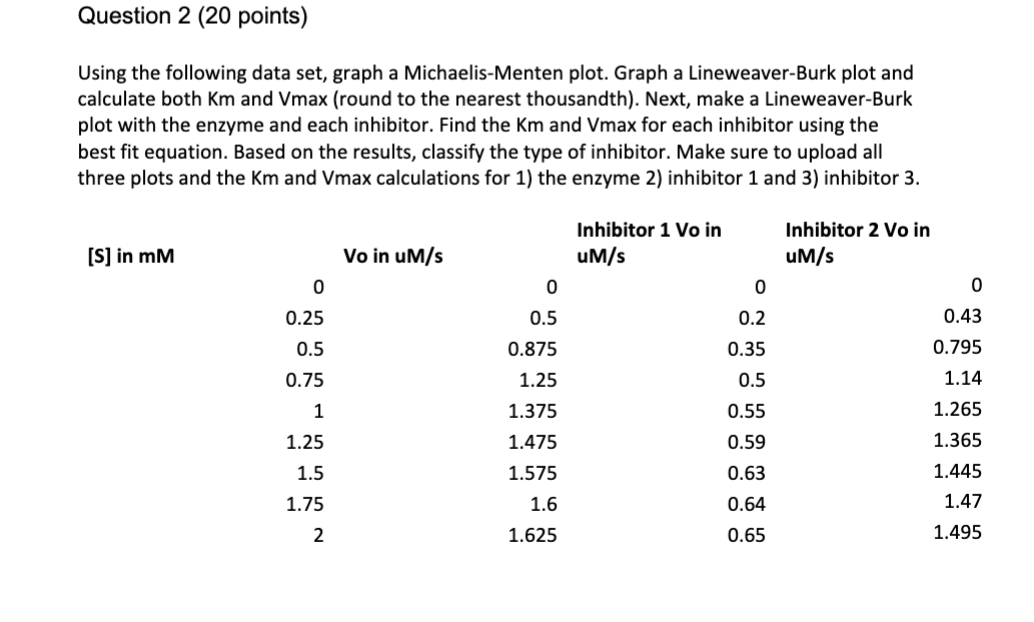
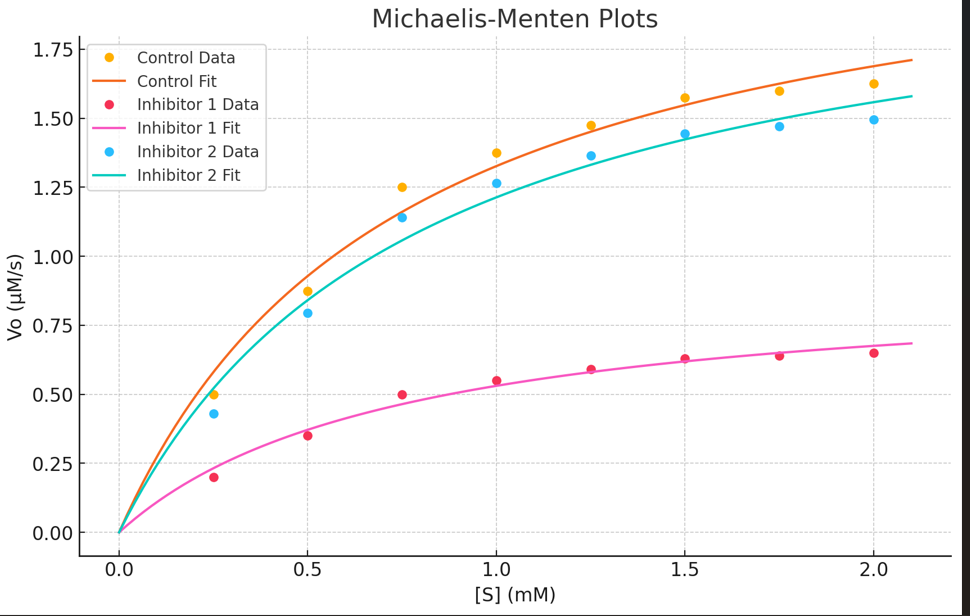
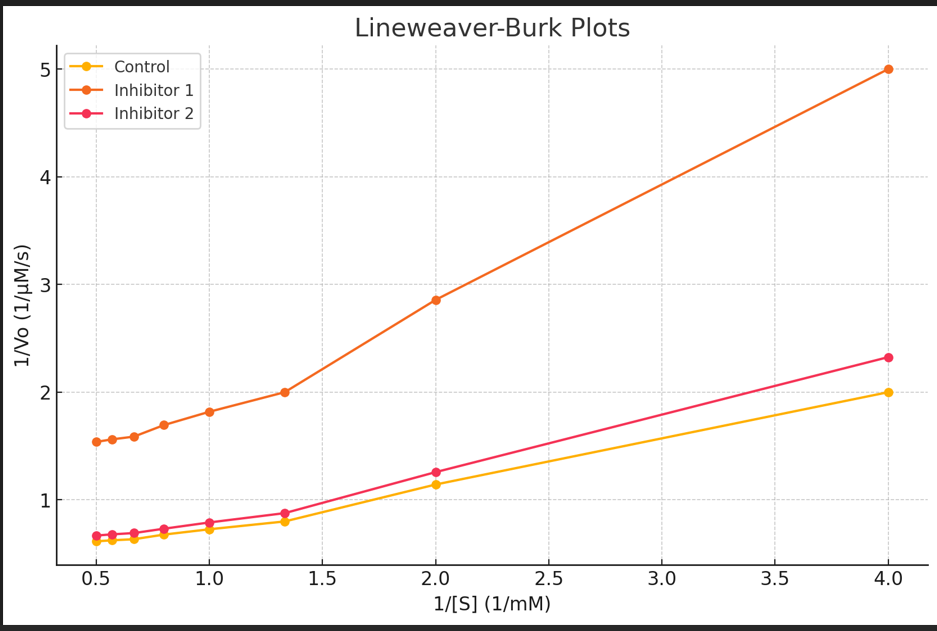
Question: Question 2 (20 points) Using the following data set, graph a Michaelis-Menten plot. Graph a Lineweaver-Burk plot and calculate both Km and Vmax (round to

Question 2 (20 points) Using the following dataQuestion 2 (20 points) Using the following dataQuestion 2 (20 points) Using the following dataQuestion 2 (20 points) Using the following dataQuestion 2 (20 points) Using the following dataQuestion 2 (20 points) Using the following dataQuestion 2 (20 points) Using the following data
Question 2 (20 points) Using the following data set, graph a Michaelis-Menten plot. Graph a Lineweaver-Burk plot and calculate both Km and Vmax (round to the nearest thousandth). Next, make a Lineweaver-Burk plot with the enzyme and each inhibitor. Find the Km and Vmax for each inhibitor using the best fit equation. Based on the results, classify the type of inhibitor. Make sure to upload all three plots and the Km and Vmax calculations for 1) the enzyme 2) inhibitor 1 and 3) inhibitor 3. [S] in mM 0.25 0.5 0.75 1.25 1.5 1.75 Vo in uM/s 0.5 0.875 1:25 1.375 1.475 1.575 1.6 1.625 Inhibitor 1 Vo in uM/s 0.2 0.35 0.5 0.55 0.59 0.63 0.64 0.65 Inhibitor 2 Vo in uM/s 0.43 0.795 1.14 1.265 1.365 1.445 1.47 1.495 Vmax [S] V = Km + [S] This is fitted non-linearly (e.g., with Excel Solver or software like GraphPad Prism) to obtain Vmax and Km. Lineweaver-Burk Transformation (Linearized) Km 1 + Vmax max\f\fYou would perform linear regression on this data (1/[S] vs. 1/Vo) to compute the slope (m) and intercept (b), then extract: s Vines 1/b s i, Tih a 1.75 1.50 0.25 0.00 Michaelis-Menten Plots Control! Data Control Fit Inhibitor 1 Data Inhibitor 1 Fit Inhibitor 2 Data Inhibitor 2 Fit 0.0 0.5 1.0 LS 2.0 [S] (mM) \f

Step by Step Solution

There are 3 Steps involved in it

1 Expert Approved Answer
Step: 1 Unlock blur-text-image
Question Has Been Solved by an Expert!

Get step-by-step solutions from verified subject matter experts

Step: 2 Unlock
Step: 3 Unlock

Students Have Also Explored These Related Accounting Questions!