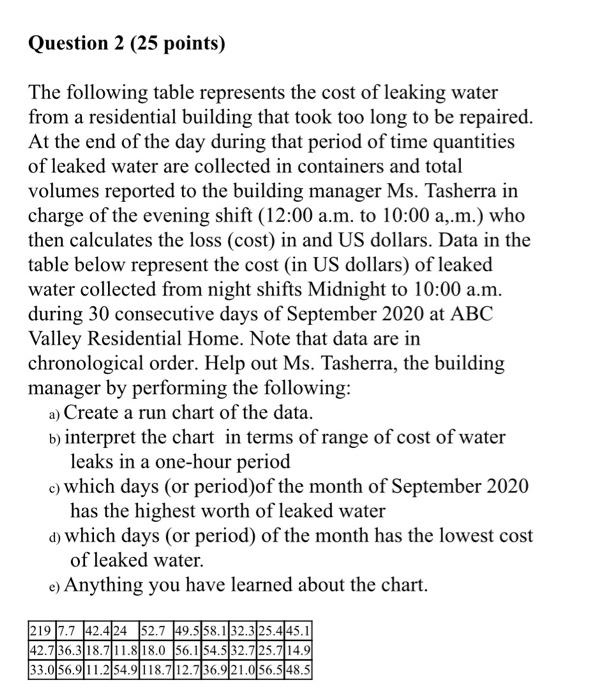
Question: Question 2 (25 points) The following table represents the cost of leaking water from a residential building that took too long to be repaired. At

Question 2 (25 points) The following table
Question 2 (25 points) The following table represents the cost of leaking water from a residential building that took too long to be repaired. At the end of the day during that period of time quantities of leaked water are collected in containers and total volumes reported to the building manager Ms. Tasherra in charge of the evening shift (12:00 a.m. to 10:00 a,.m.) who then calculates the loss (cost) in and US dollars. Data in the table below represent the cost (in US dollars) of leaked water collected from night shifts Midnight to 10:00 a.m. during 30 consecutive days of September 2020 at ABC Valley Residential Home. Note that data are in chronological order. Help out Ms. Tasherra, the building manager by performing the following: a) Create a run chart of the data. b) interpret the chart in terms of range of cost of water leaks in a one-hour period c) which days (or period)of the month of September 2020 has the highest worth of leaked water d) which days (or period) of the month has the lowest cost of leaked water. e) Anything you have learned about the chart. 219 7.7 42.4 24 52.7 49.5 58.132.3 25.445.1 42.736.318.711.818.0 56.154.532.7 25.714.9 33.0 56.911.2 54.9118.712.7 36.9 21.0 56.548.5

Step by Step Solution

There are 3 Steps involved in it

1 Expert Approved Answer
Step: 1 Unlock blur-text-image
Question Has Been Solved by an Expert!

Get step-by-step solutions from verified subject matter experts

Step: 2 Unlock
Step: 3 Unlock

Students Have Also Explored These Related General Management Questions!