

Question: Question 2 ( 3 0 points ) The figure below shows TTT and CCT curves superimposed on one diagram for a eutectoid steel. Using this
Question points
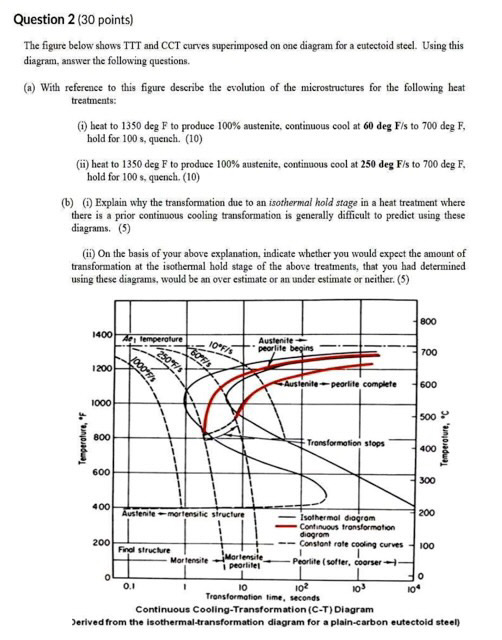
The figure below shows TTT and CCT curves superimposed on one diagram for a eutectoid steel. Using this diagram, answer the following questions.
a With reference to this figure describe the evolution of the microstructures for the following heat treatments:
i heat to deg F to produce austenite, continuous cool at mathrmdegmathrmFmathrms to deg F hold for s quench.
ii heat to deg F to produce austenite, continuous cool at mathrmdegmathrmFmathrms to deg F hold for s quench.
bi Explain why the transformation due to an isothermal hold stage in a heat treatment where there is a prior continuous cooling transformation is generally difficult to predict using these diagrams.
ii On the basis of your above explanation, indicate whether you would expect the amount of transformation at the isothermal hold stage of the above treatments, that you had determined using these diagrams, would be an over estimate or an under estimate or neither.
Jerived from the isothermaltransformation diagram for a plaincarbon eutectoid steel
Step by Step Solution
There are 3 Steps involved in it
1 Expert Approved Answer
Step: 1 Unlock

Question Has Been Solved by an Expert!
Get step-by-step solutions from verified subject matter experts
Step: 2 Unlock
Step: 3 Unlock