

Question: QUESTION 2 3 - 3 POINTS Use Desmos to graph the curve represented by the parametric equation x = s i n ( t )
QUESTION POINTS
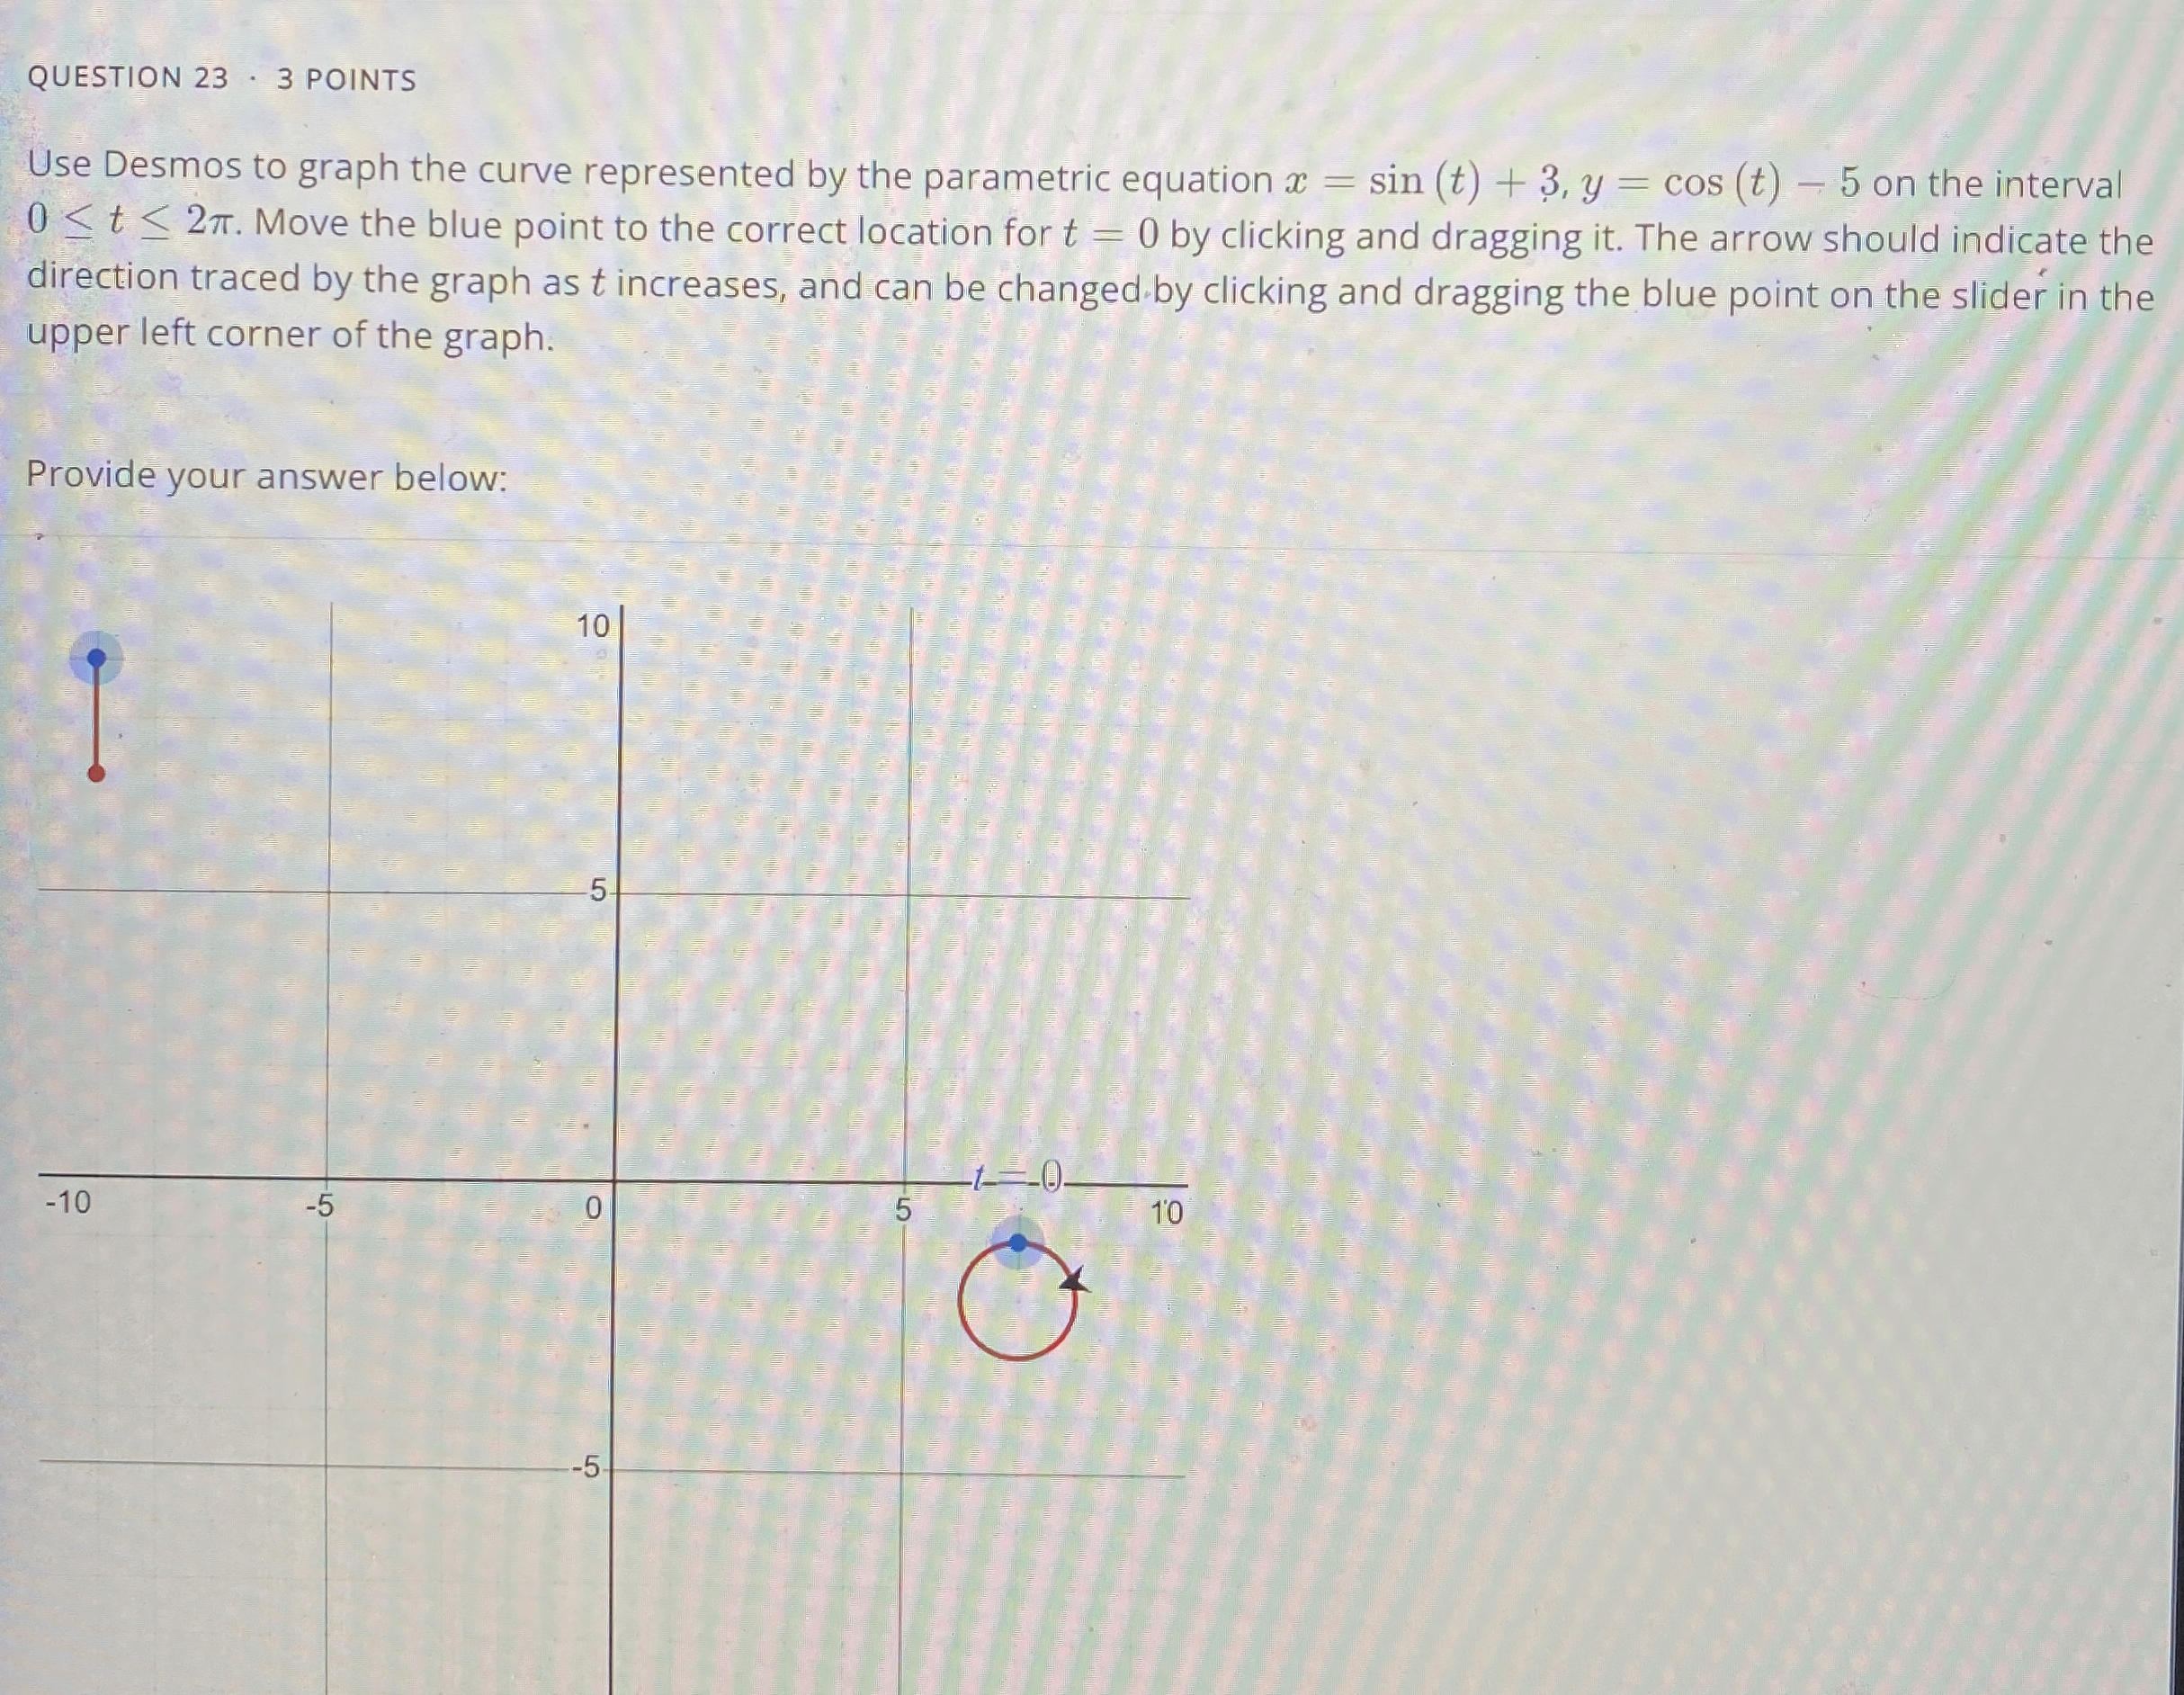
Use Desmos to graph the curve represented by the parametric equation on the interval Move the blue point to the correct location for by clicking and dragging it The arrow should indicate the direction traced by the graph as increases, and can be changed by clicking and dragging the blue point on the slider in the upper left corner of the graph.
Provide your answer below:
Step by Step Solution
There are 3 Steps involved in it
1 Expert Approved Answer
Step: 1 Unlock

Question Has Been Solved by an Expert!
Get step-by-step solutions from verified subject matter experts
Step: 2 Unlock
Step: 3 Unlock