

Question: QUESTION 2 3 The table provided below represents the a b s o l u t e deviations for each forecast prepared b y the
QUESTION
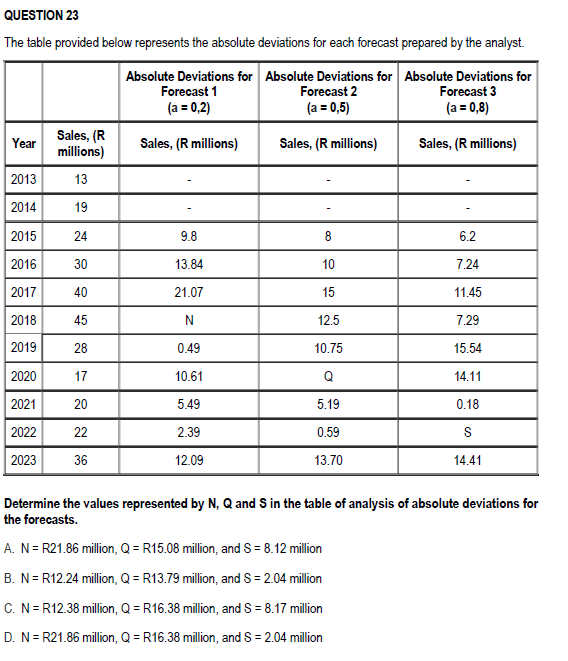
The table provided below represents the deviations for each forecast prepared the analyst.
Determine the values represented and the table analysis deviations for
the forecasts.
million, million, and million
million, million, and million
million, million, and million
million, million, and million
Step by Step Solution
There are 3 Steps involved in it
1 Expert Approved Answer
Step: 1 Unlock

Question Has Been Solved by an Expert!
Get step-by-step solutions from verified subject matter experts
Step: 2 Unlock
Step: 3 Unlock