

Question: Question 2 (35 points) Consider two stocks, A, B. Over the investment horizon, only three equally likely scenarios are possible. The returns on stock A
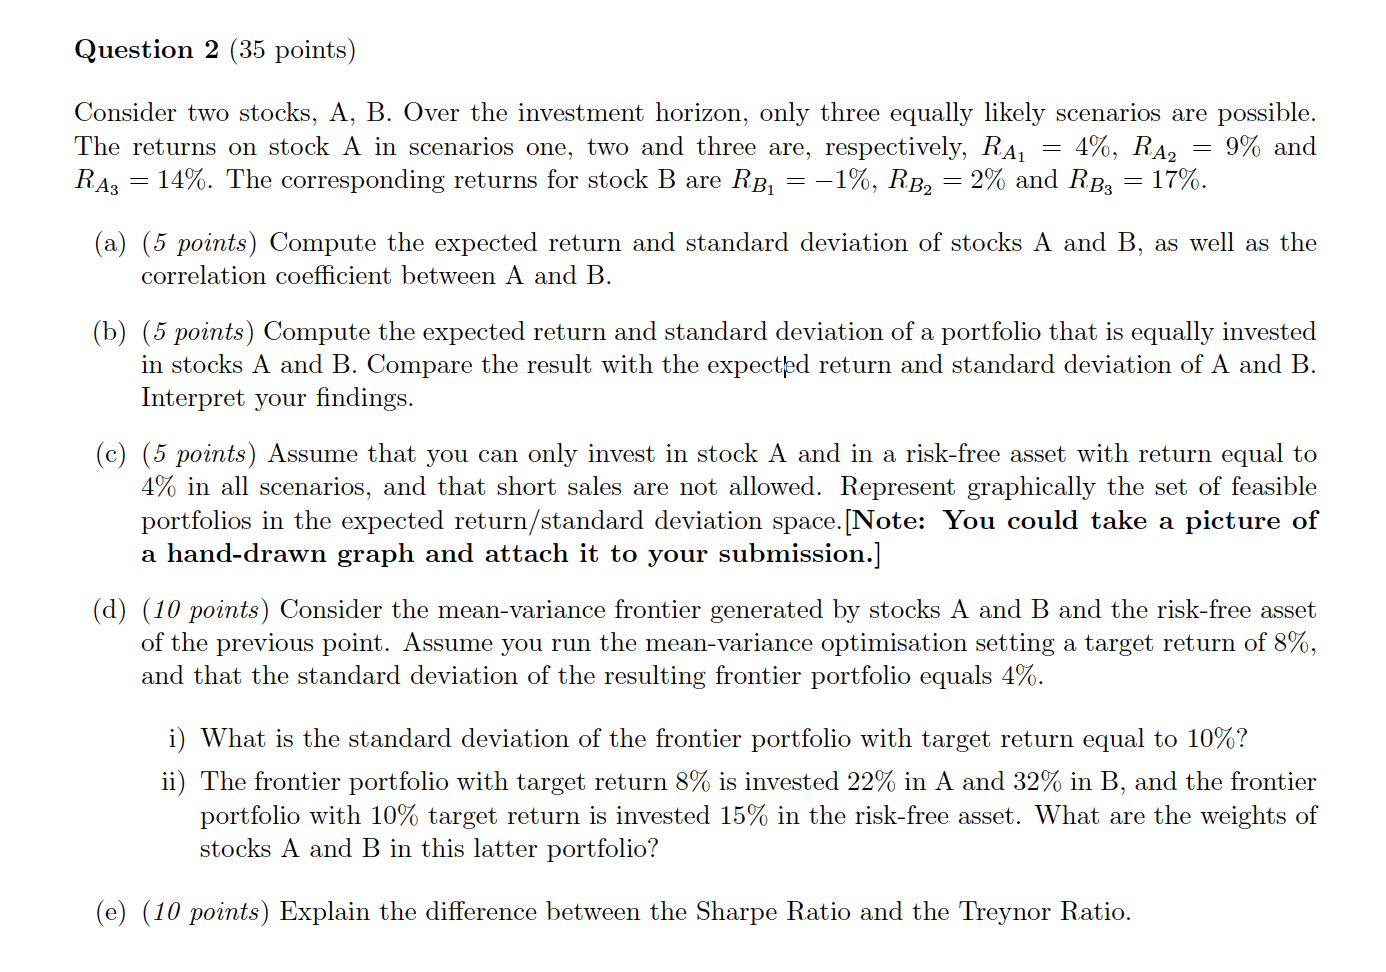
Question 2 (35 points) Consider two stocks, A, B. Over the investment horizon, only three equally likely scenarios are possible. The returns on stock A in scenarios one, two and three are, respectively, RA 4%, RA2 9% and 14%. The corresponding returns for stock B are RB= -1%, RB2 = 2% and RB; = 17%. = RA = (a) (5 points) Compute the expected return and standard deviation of stocks A and B, as well as the correlation coefficient between A and B. (b) (5 points) Compute the expected return and standard deviation of a portfolio that is equally invested in stocks A and B. Compare the result with the expected return and standard deviation of A and B. Interpret your findings. (c) (5 points) Assume that you can only invest in stock A and in a risk-free asset with return equal to 4% in all scenarios, and that short sales are not allowed. Represent graphically the set of feasible portfolios in the expected return/standard deviation space. [Note: You could take a picture of a hand-drawn graph and attach it to your submission.] (d) (10 points) Consider the mean-variance frontier generated by stocks A and B and the risk-free asset of the previous point. Assume you run the mean-variance optimisation setting a target return of 8%, and that the standard deviation of the resulting frontier portfolio equals 4%. i) What is the standard deviation of the frontier portfolio with target return equal to 10%? ii) The frontier portfolio with target return 8% is invested 22% in A and 32% in B, and the frontier portfolio with 10% target return is invested 15% in the risk-free asset. What are the weights of stocks A and B in this latter portfolio? (e) (10 points) Explain the difference between the Sharpe Ratio and the Treynor Ratio. Question 2 (35 points) Consider two stocks, A, B. Over the investment horizon, only three equally likely scenarios are possible. The returns on stock A in scenarios one, two and three are, respectively, RA 4%, RA2 9% and 14%. The corresponding returns for stock B are RB= -1%, RB2 = 2% and RB; = 17%. = RA = (a) (5 points) Compute the expected return and standard deviation of stocks A and B, as well as the correlation coefficient between A and B. (b) (5 points) Compute the expected return and standard deviation of a portfolio that is equally invested in stocks A and B. Compare the result with the expected return and standard deviation of A and B. Interpret your findings. (c) (5 points) Assume that you can only invest in stock A and in a risk-free asset with return equal to 4% in all scenarios, and that short sales are not allowed. Represent graphically the set of feasible portfolios in the expected return/standard deviation space. [Note: You could take a picture of a hand-drawn graph and attach it to your submission.] (d) (10 points) Consider the mean-variance frontier generated by stocks A and B and the risk-free asset of the previous point. Assume you run the mean-variance optimisation setting a target return of 8%, and that the standard deviation of the resulting frontier portfolio equals 4%. i) What is the standard deviation of the frontier portfolio with target return equal to 10%? ii) The frontier portfolio with target return 8% is invested 22% in A and 32% in B, and the frontier portfolio with 10% target return is invested 15% in the risk-free asset. What are the weights of stocks A and B in this latter portfolio? (e) (10 points) Explain the difference between the Sharpe Ratio and the Treynor Ratio
Step by Step Solution
There are 3 Steps involved in it

Get step-by-step solutions from verified subject matter experts