

Question: Sample value of the test statistic: Level of significance: An executive in an accounting firm has claimed that the average tax return of their
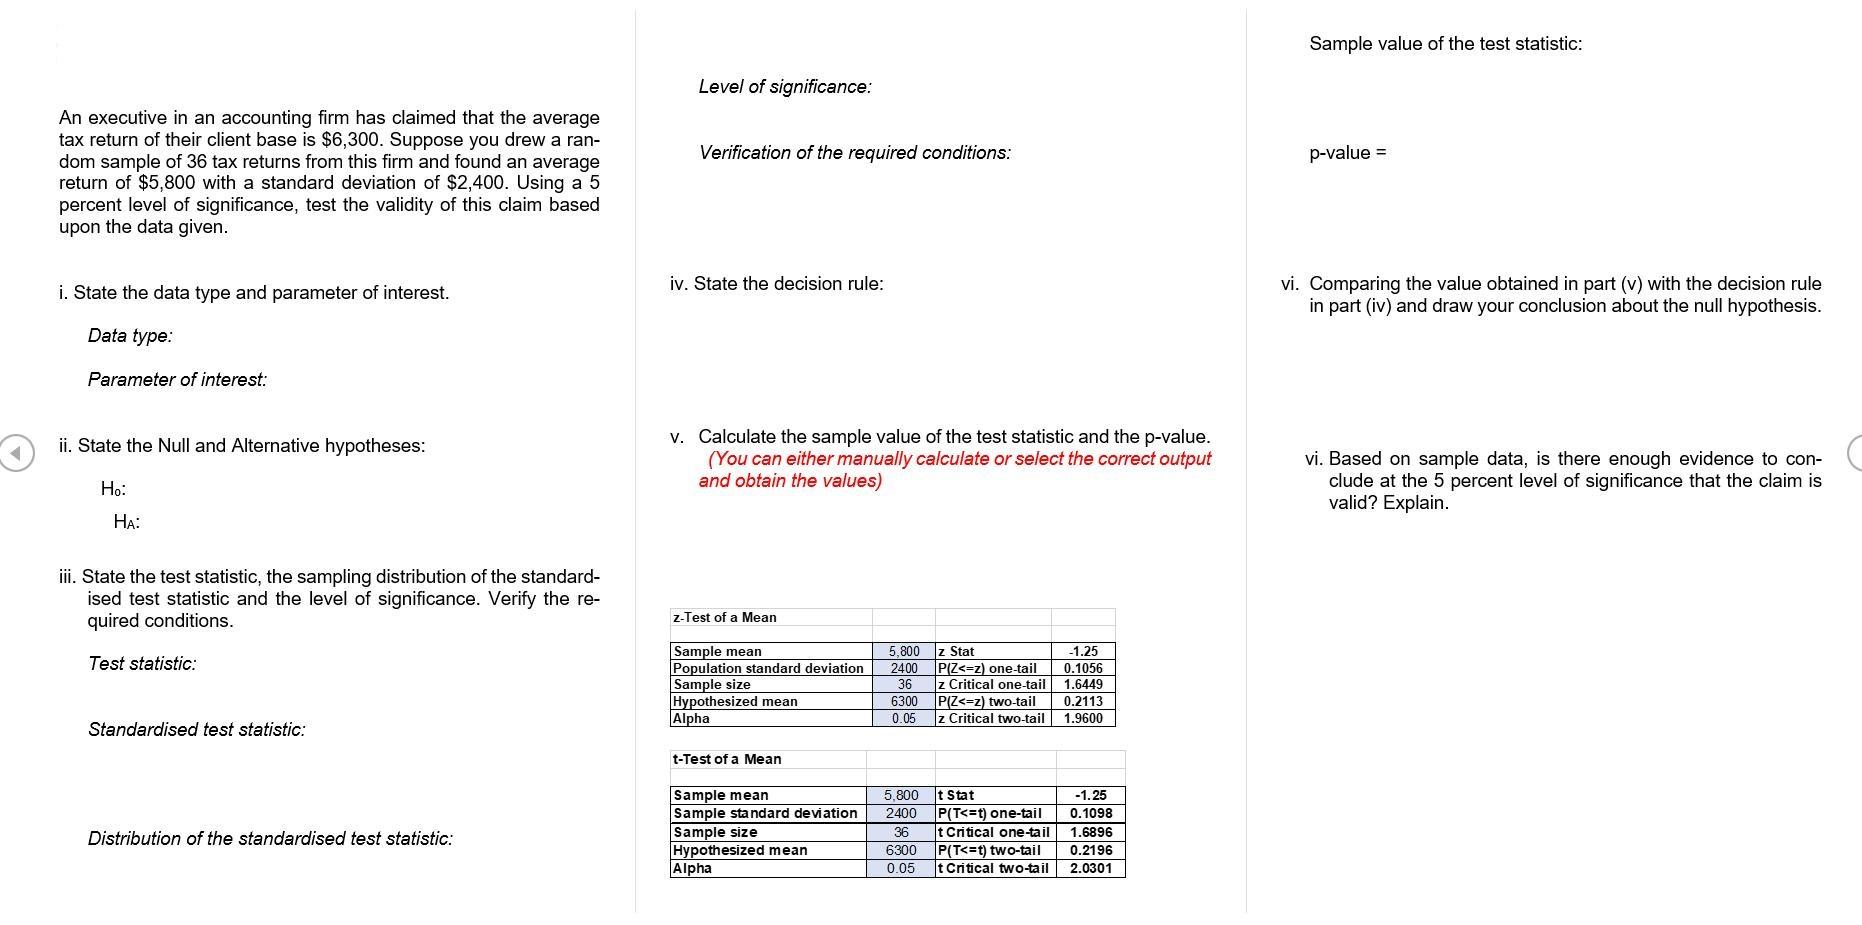
Sample value of the test statistic: Level of significance: An executive in an accounting firm has claimed that the average tax return of their client base is $6,300. Suppose you drew a ran- dom sample of 36 tax returns from this firm and found an average return of $5,800 with a standard deviation of $2,400. Using a 5 percent level of significance, test the validity of this claim based upon the data given. Verification of the required conditions: p-value = iv. State the decision rule: i. State the data type and parameter of interest. vi. Comparing the value obtained in part (v) with the decision rule in part (iv) and draw your conclusion about the null hypothesis. Data type: Parameter of interest: v. Calculate the sample value of the test statistic and the p-value. (You can either manually calculate or select the correct output and obtain the values) ii. State the Null and Alternative hypotheses: vi. Based on sample data, is there enough evidence to con- clude at the 5 percent level of significance that the claim is valid? Explain. Ho: : iii. State the test statistic, the sampling distribution of the standard- ised test statistic and the level of significance. Verify the re- quired conditions. z-Test of a Mean Sample mean Population standard deviation Sample size Hypothesized mean Alpha z Stat P(Z
Step by Step Solution
3.49 Rating (159 Votes )
There are 3 Steps involved in it

Get step-by-step solutions from verified subject matter experts