

Question: QUESTION 2 5 The defect rate for a product has historically been about 1 . 5 % . If samples of size of n =
QUESTION
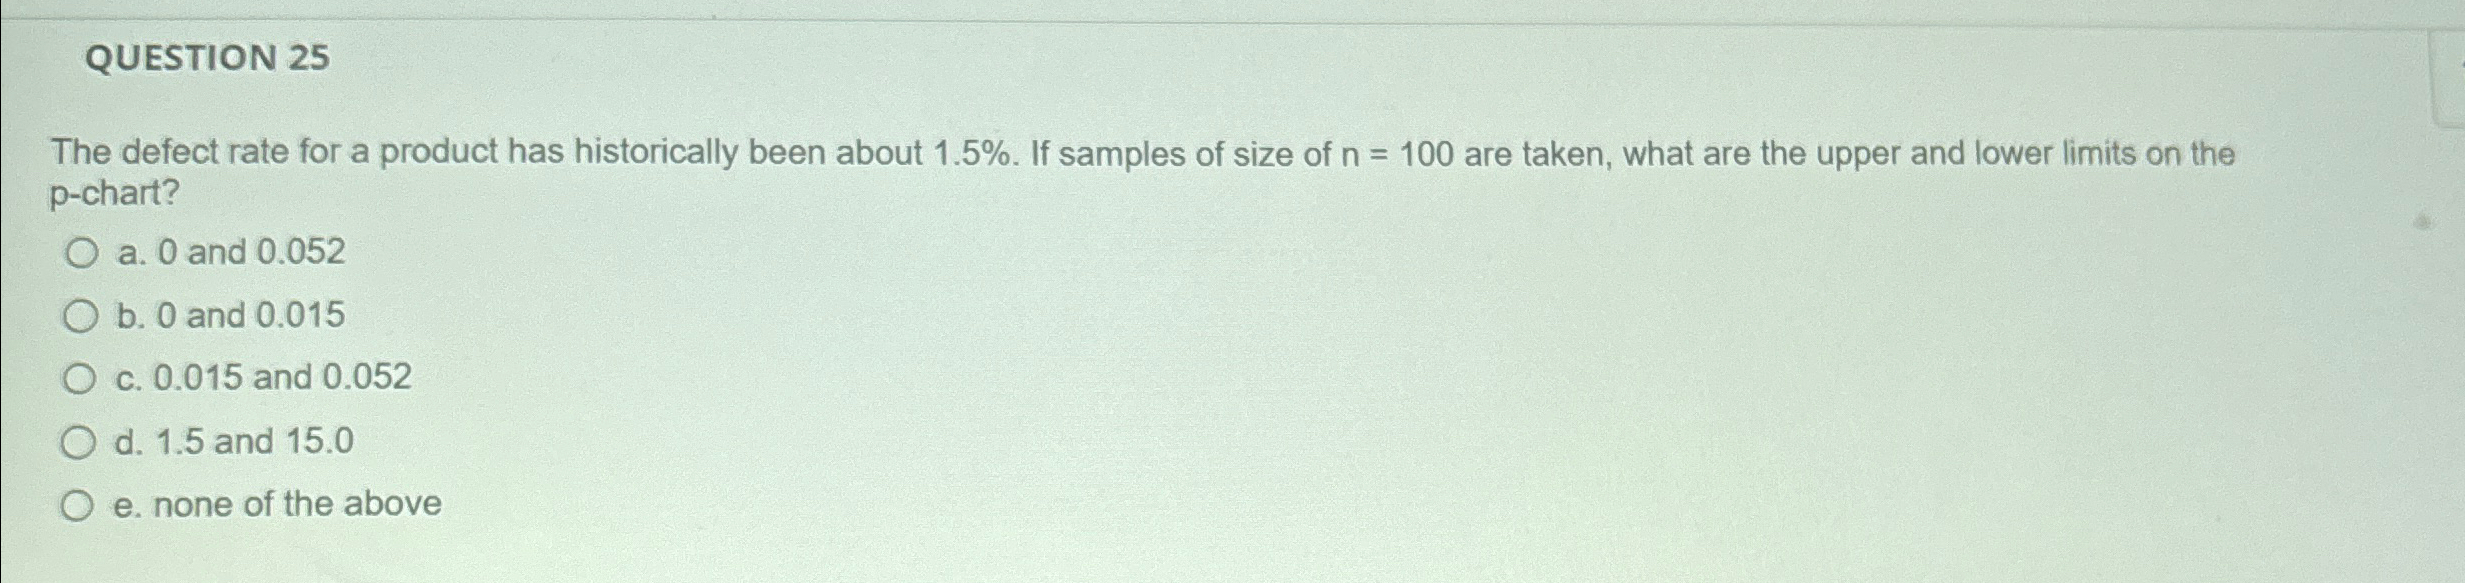
The defect rate for a product has historically been about If samples of size of are taken, what are the upper and lower limits on the pchart?
a and
b and
c and
d and
e none of the above
Step by Step Solution
There are 3 Steps involved in it
1 Expert Approved Answer
Step: 1 Unlock

Question Has Been Solved by an Expert!
Get step-by-step solutions from verified subject matter experts
Step: 2 Unlock
Step: 3 Unlock