

Question: Question 2 (6 Marks) From the following chart, the red line shows Euro junk bond yield and the black line shows the US Treasury 10-year
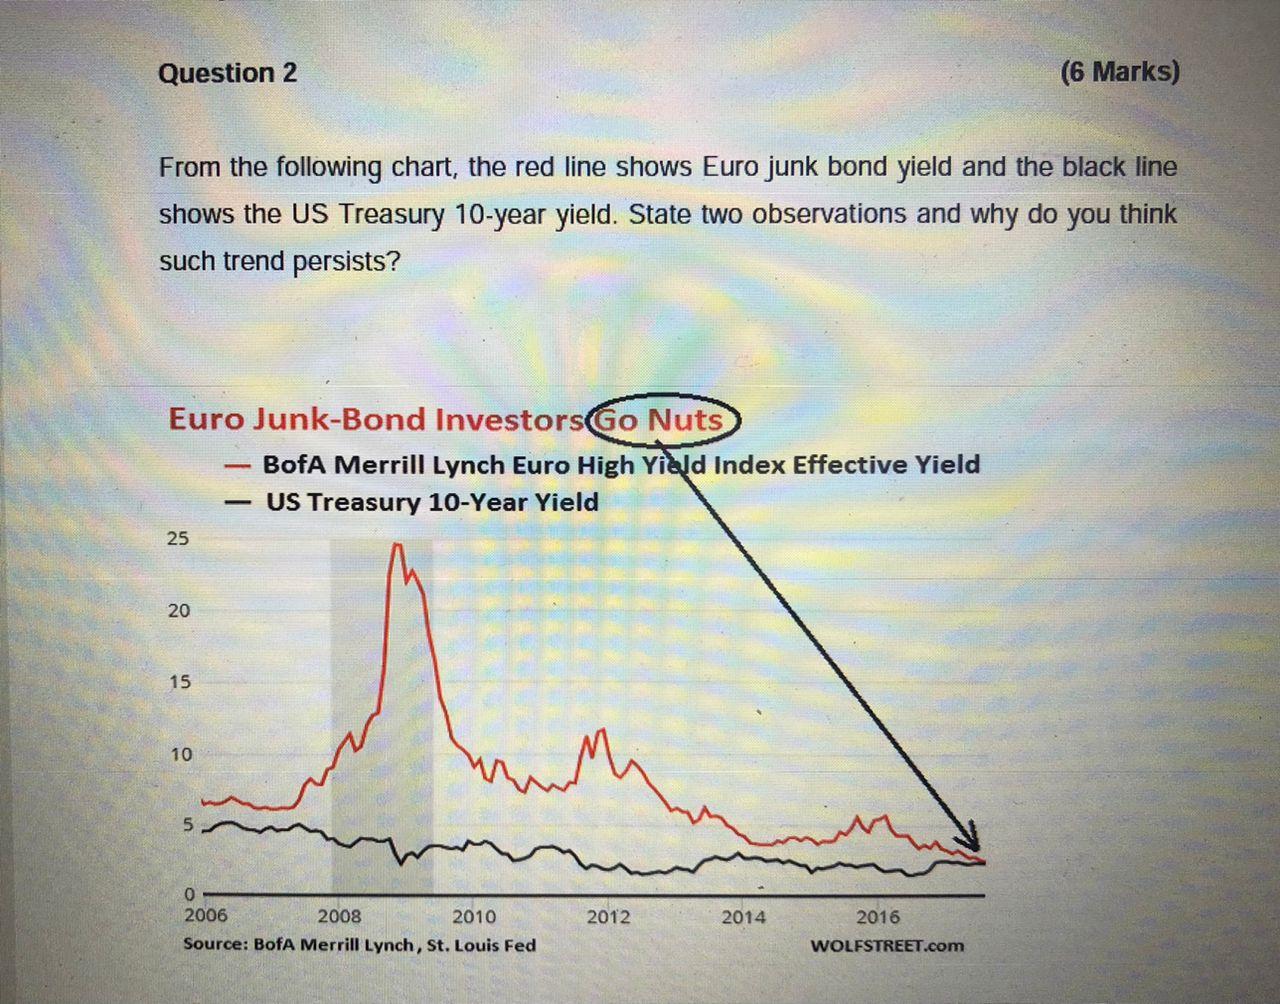
Question 2 (6 Marks) From the following chart, the red line shows Euro junk bond yield and the black line shows the US Treasury 10-year yield. State two observations and why do you think such trend persists? Euro Junk-Bond Investors Go Nuts BofA Merrill Lynch Euro High Yield Index Effective Yield US Treasury 10-Year Yield - 25 20 15 10 5 0 2006 2008 2010 Source: BofA Merrill Lynch, St. Louis Fed 2012 2014 2016 WOLFSTREET.com
Step by Step Solution
There are 3 Steps involved in it
1 Expert Approved Answer
Step: 1 Unlock

Question Has Been Solved by an Expert!
Get step-by-step solutions from verified subject matter experts
Step: 2 Unlock
Step: 3 Unlock