

Question: Question 2 (8 marks) Using the data generated in the previous question (Question 1); a) Plot the Security Market Line (SML) (2 marks) b) Superimpose
Question 2 (8 marks) Using the data generated in the previous question (Question 1);
a) Plot the Security Market Line (SML) (2 marks)
b) Superimpose the CAPMs required return on the SML (2 marks)
c) Indicate which investments will plot on, above and below the SML? (2 marks)
d) If an investments expected return (mean return) does not plot on the SML, what does it show? Identify undervalued/overvalued investments from the graph (2 marks)
Question 3 (4 marks) From the information generated in the previous two questions;
a) Identify two investment alternatives that can be combined in a portfolio. Assume a 50- 50 investment allocation in each investment alternative (1 mark)
b) Compute the expected return of the portfolio thus formed (1 mark)
c) Compute the portfolios beta. Is the portfolio aggressive or defensive? (2 marks
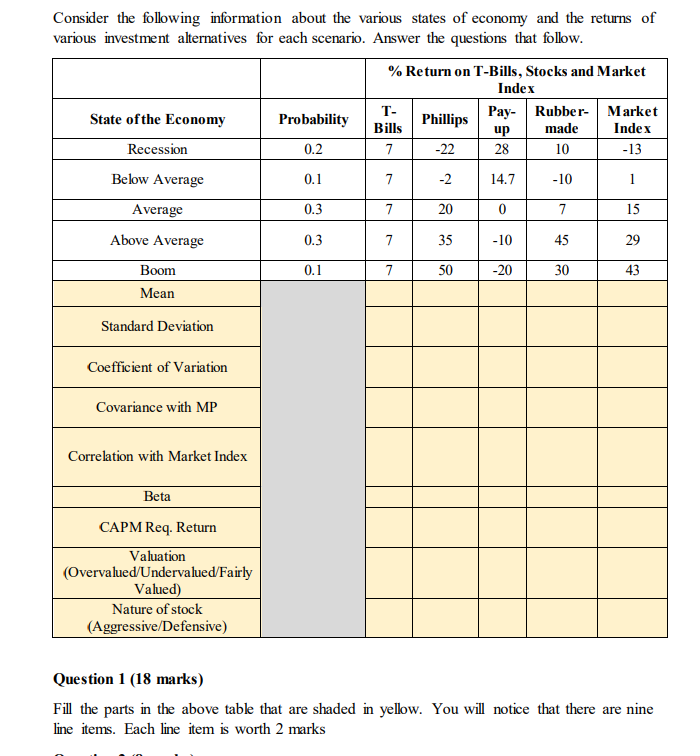
Consider the following information about the various states of economy and the returns of various investment alternatives for each scenarin Answer the alestions that follow Question 1 (18 marks) Fill the parts in the above table that are shaded in yellow. You will notice that there are nine line items. Each line item is worth 2 marks
Step by Step Solution
There are 3 Steps involved in it

Get step-by-step solutions from verified subject matter experts