

Question: Question 2 . ( 8 points ) : ( Open response ) The following questions are based on the Assignment 8 - Q 2 -
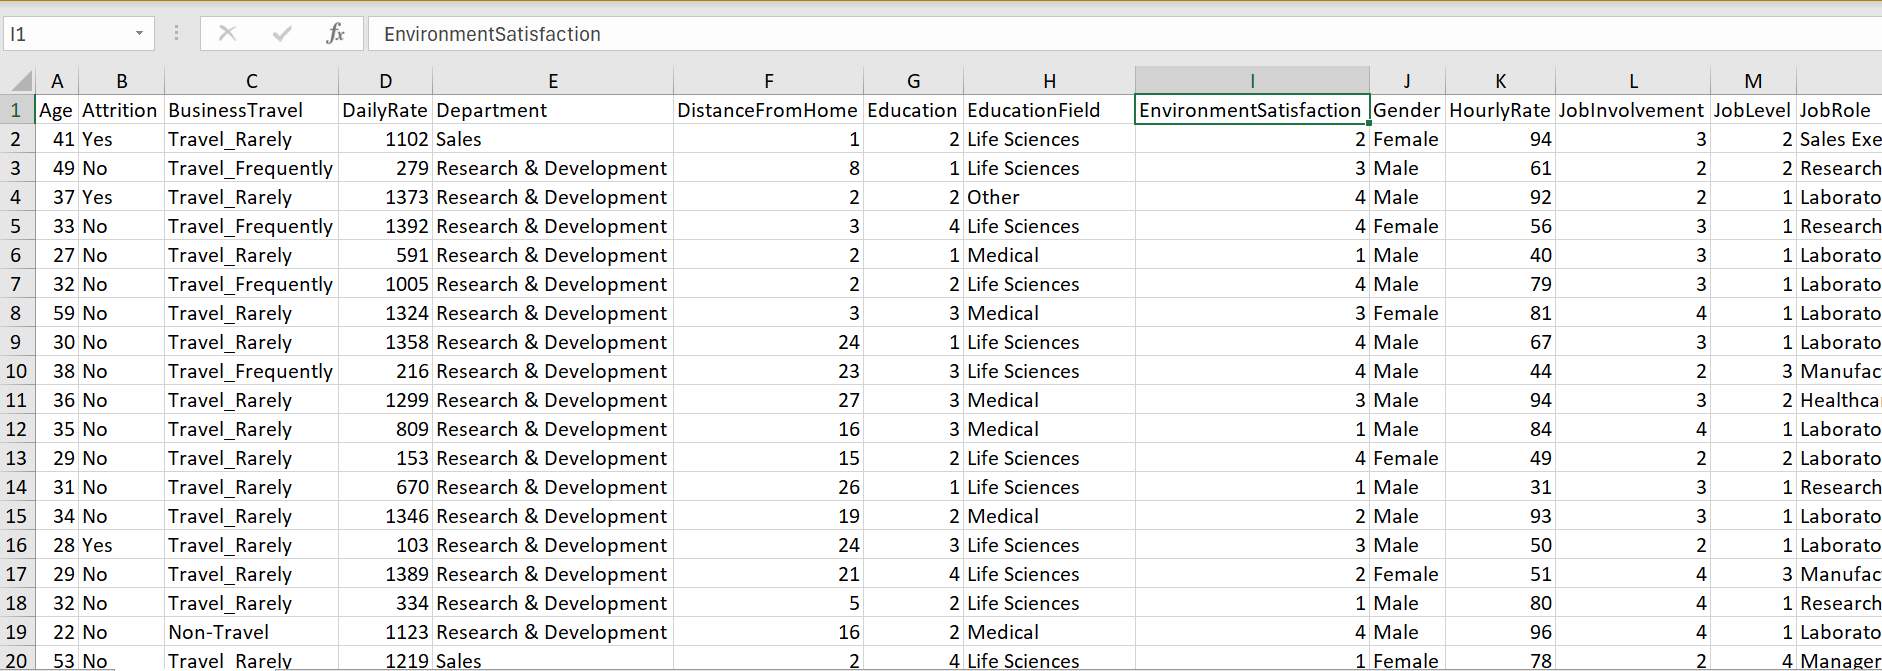
Question points: Open response The following questions are based on the AssignmentQIBMDataClean.xlsx data file. Please submit two files for all the following questions. The ipynb file clearly showing all the code you wrote and the results for each cell. For the data set you created in Python, use head to show the first few lines in the data. Clearly mark which question each cell is written for. A word file with answers to the questions. Please clearly mark the question numbers for your answers. You can also write all the answers in the ipynb file without submitting the Word file. Question points: Use functions provided by pandas to process the AssignmentQIBMDataClean.xlsx data file to get a subset of the data ready for numeric prediction. From all the attributes available in the file, pick one numeric attribute to be the dependent variable y and pick or more if you prefer other reasonable numeric attributes as the independent variables X The final data after processing should be stored in a variable whose type is DataFrame. Tip: Use the following way to select a subset of data. datadataAttribute"Attribute Attribute Question : Instead of using functions from pandas, use file readingwriting and whilefor loops to process each line in the data file to perform the same task described in Question ie pick y & X and store as a DataFrame You should first save AssignmentQIBMDataClean.xlsx as a CSV comma delimited file before using open to open it Tip: You can open one file for read, and one new csv file for writing. For each line, split it using the comma as a delimiter to separate the attributes into a list. Select the desired attributes from the list using indexes. Use string concatenation to connect the desired attributes to construct the new line dont forget to add
at the end of the line then write the new line into the new file. After the new file is closed, you can use readcsv to convert it to DataFrame. Question points: Use the DataFrame you created in either Question or Question to create the correlation matrix. If you fail to successfully finish Question and Question you can just take the subset y&X of the data in Excel, read it using readexcel from pandas, and use that data for this task and the following tasks. Briefly discuss what you can learn from the correlation matrix. Question points: Split the data into Training and Testing Question points: Build Lasso, Regression Tree and Random Forest models for the data. Report RMSE and RRSE for these three models. In addition, use results from the correlation matrix, the coefficients from the Lasso linear regression model, and the feature importance generated by the Regression Tree model to discuss what you can learn from these results. For example, discuss which X variable has the strongest or steepest linear relationship with the y variable, etc.
A
B
C
F
G
E
H
D
EnvironmentSatisfaction
Step by Step Solution
There are 3 Steps involved in it
1 Expert Approved Answer
Step: 1 Unlock

Question Has Been Solved by an Expert!
Get step-by-step solutions from verified subject matter experts
Step: 2 Unlock
Step: 3 Unlock