

Question: QUESTION 2 a) Discuss how to decide between a random effects regression in panel data and a simple OLS regression. [10 MARKS] b) Explain how
QUESTION 2 a) Discuss how to decide between a random effects regression in panel data and a simple OLS regression. [10 MARKS] b) Explain how to decide between fixed or random effects in a panel data regression.
c) According to the tests reported in the table below, what is the best model to run? Please, support your answer with a clear discussion of the econometric tests used and their interpretation. 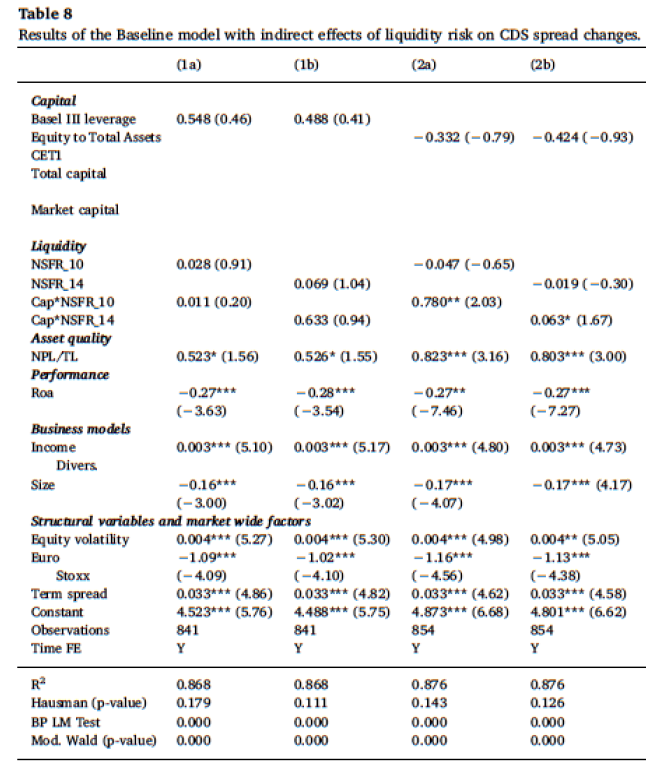
d) Explain the Least Squares Dummy Variable (LSDV) model and how it solves the problem that one (or more) regressor(s) may be correlated with the time-invariant component of the error term.
PLEASE ANSWER ALL QUESTION
Table 8 Results of the Baseline model with indirect effects of liquidity risk on CDS spread changes. (la) (1b) (2) (2b) 0.548 (0.46) 0.488 (0.41) Capital Basel III leverage Equity to Total Assets Total capital -0.332 (-0.79) -0.424 (-0.93) Market capital Liquidity NSFR_10 0.028 (0.91) -0.047 (-0.65) NSFR_14 0.069 (1.04) -0.019 (-0.30) Cap*NSFR 10 0.011 (0-20) 0.780** (2.03) Cap*NSFR 14 0.633 (0.94) 0.063* (1.67) Asset quality NPL/TL 0.523* (1.56) 0.526* (1.55) 0.823*** (3.16) 0.803*** (3.00) Performance Roa -0.27*** -0.28*** -0.27** -0.27 *** (-3.63) (-3.54) (-7.46) (-7.27) Business models Income 0.003*** (5.10) 0.003*** (5.17) 0.003*** (4.80) 0.003*** (4.73) Divers Size -0.16*** -0.16*** -0.17*** -0.17*** (4.17) (-3.00) (-3.02) (-4.07) Structural variables and market wide factors Equity volatility 0.004*** (5.27) 0.004*** (5.30) 0.004*** (4.98) 0.004** (5.05) Puro -1.09*** - 1.02*** - 1.16*** - 1.13*** Stoxx (-4.09) (-4.10) (-4.56) (-4.38) Term spread 0.033*** (4.86) 0.033*** (482) 0.033*** (4.62) 0.033*** (4.58) Constant 4.523*** (5.76) 4.488*** (5.75) 4.873*** (6.68) 4.801*** (6.62) Observations 841 841 854 854 Time FE Y Y Y Y R 0.868 0.868 0.876 0.876 Hausman (p-value) 0.179 0.111 0.143 0.126 BP LM Test 0.000 0.000 0.000 0.000 Mod. Wald (p-value) 0.000 0.000 0.000 0.000 Table 8 Results of the Baseline model with indirect effects of liquidity risk on CDS spread changes. (la) (1b) (2) (2b) 0.548 (0.46) 0.488 (0.41) Capital Basel III leverage Equity to Total Assets Total capital -0.332 (-0.79) -0.424 (-0.93) Market capital Liquidity NSFR_10 0.028 (0.91) -0.047 (-0.65) NSFR_14 0.069 (1.04) -0.019 (-0.30) Cap*NSFR 10 0.011 (0-20) 0.780** (2.03) Cap*NSFR 14 0.633 (0.94) 0.063* (1.67) Asset quality NPL/TL 0.523* (1.56) 0.526* (1.55) 0.823*** (3.16) 0.803*** (3.00) Performance Roa -0.27*** -0.28*** -0.27** -0.27 *** (-3.63) (-3.54) (-7.46) (-7.27) Business models Income 0.003*** (5.10) 0.003*** (5.17) 0.003*** (4.80) 0.003*** (4.73) Divers Size -0.16*** -0.16*** -0.17*** -0.17*** (4.17) (-3.00) (-3.02) (-4.07) Structural variables and market wide factors Equity volatility 0.004*** (5.27) 0.004*** (5.30) 0.004*** (4.98) 0.004** (5.05) Puro -1.09*** - 1.02*** - 1.16*** - 1.13*** Stoxx (-4.09) (-4.10) (-4.56) (-4.38) Term spread 0.033*** (4.86) 0.033*** (482) 0.033*** (4.62) 0.033*** (4.58) Constant 4.523*** (5.76) 4.488*** (5.75) 4.873*** (6.68) 4.801*** (6.62) Observations 841 841 854 854 Time FE Y Y Y Y R 0.868 0.868 0.876 0.876 Hausman (p-value) 0.179 0.111 0.143 0.126 BP LM Test 0.000 0.000 0.000 0.000 Mod. Wald (p-value) 0.000 0.000 0.000 0.000
Step by Step Solution
There are 3 Steps involved in it

Get step-by-step solutions from verified subject matter experts