

Question: Question 2: A (LO, 4/ 10 Marks) This table shows the quantities consumed of one commodity and the total utility gained from this commodity. Marginal
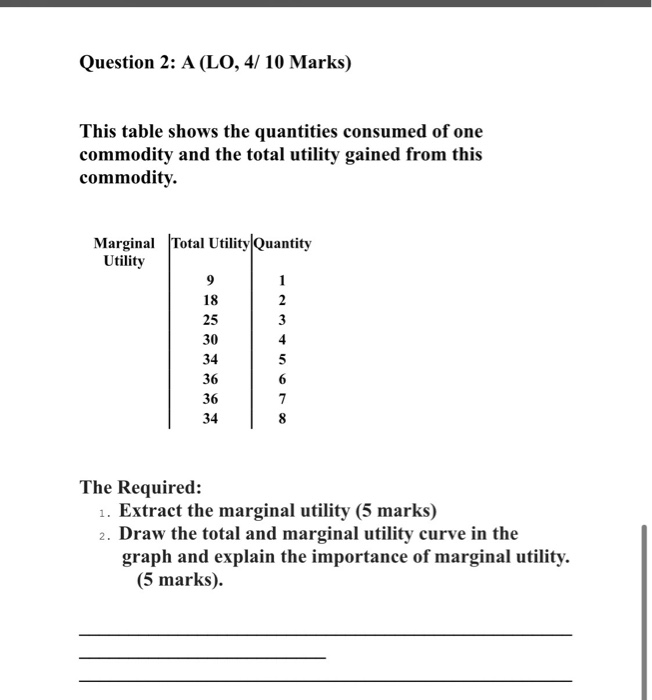
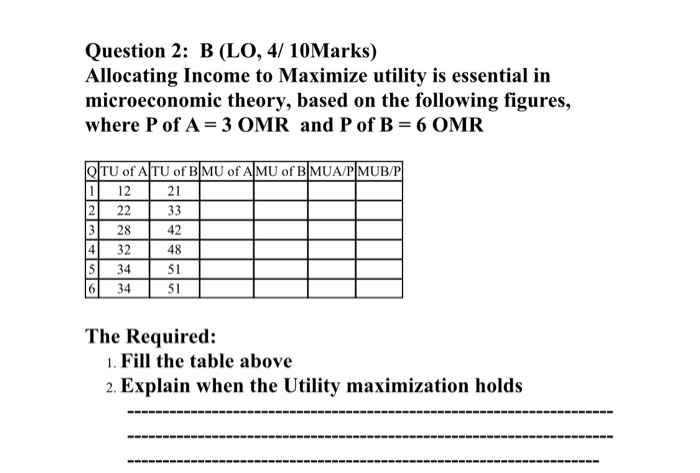
Question 2: A (LO, 4/ 10 Marks) This table shows the quantities consumed of one commodity and the total utility gained from this commodity. Marginal Total UtilityQuantity Utility 9 18 2 25 3 30 4 34 5 36 6 36 7 34 8 The Required: 1. Extract the marginal utility (5 marks) 2. Draw the total and marginal utility curve in the graph and explain the importance of marginal utility. (5 marks). Question 2: B (LO, 4/10Marks) Allocating Income to Maximize utility is essential in microeconomic theory, based on the following figures, where P of A= 3 OMR and P of B = 6 OMR O TU of ATU of BMU of AMU of B MUA/PMUB/P 11 12 21 21 22 33 3 28 42 4 32 48 5 34 51 61 34 51 The Required: 1. Fill the table above 2. Explain when the Utility maximization holds
Step by Step Solution
There are 3 Steps involved in it

Get step-by-step solutions from verified subject matter experts