

Question: a) Plot sin(@) and cos(0) for 0ses2r in the same plot. i) add labels and a legend, ii) Use different line styles and colors
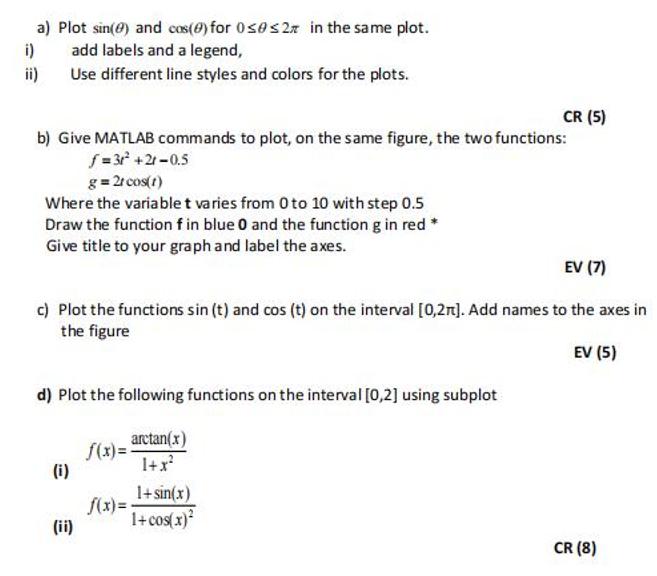
a) Plot sin(@) and cos(0) for 0ses2r in the same plot. i) add labels and a legend, ii) Use different line styles and colors for the plots. CR (5) b) Give MATLAB commands to plot, on the same figure, the two functions: f = 3 +21-0.5 g = 2r cos(t) Where the variablet varies from 0 to 10 with step 0.5 Draw the function f in blue 0 and the function g in red * Give title to your graph and label the axes. EV (7) c) Plot the functions sin (t) and cos (t) on the interval [0,2r). Add names to the axes in the figure EV (5) d) Plot the following functions on the interval [0,2] using subplot S(x)= Actan(x) (i) 1+x 1+ sin(x) S(x) = 1+ cos(x) (ii) CR (8)
Step by Step Solution
3.40 Rating (150 Votes )
There are 3 Steps involved in it
Following is the matlabcode for all the parts with comments in it yo... View full answer

Get step-by-step solutions from verified subject matter experts