

Question: Question 2 (a) The table below shows the survey data about household's trips for income groups and car ownership. In each cell, the average value
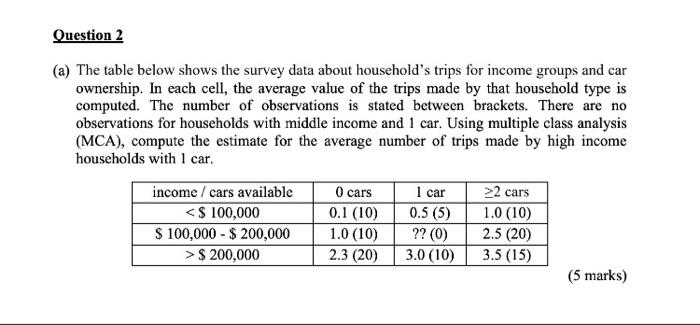
Question 2 (a) The table below shows the survey data about household's trips for income groups and car ownership. In each cell, the average value of the trips made by that household type is computed. The number of observations is stated between brackets. There are no observations for households with middle income and 1 car. Using multiple class analysis (MCA), compute the estimate for the average number of trips made by high income households with 1 car. income / cars available O cars I car >2 cars $ 200,000 2.3 (20) 3.0 (10) 3.5 (15) (5 marks) 0.5 (5) Question 2 (a) The table below shows the survey data about household's trips for income groups and car ownership. In each cell, the average value of the trips made by that household type is computed. The number of observations is stated between brackets. There are no observations for households with middle income and 1 car. Using multiple class analysis (MCA), compute the estimate for the average number of trips made by high income households with 1 car. income / cars available O cars I car >2 cars $ 200,000 2.3 (20) 3.0 (10) 3.5 (15) (5 marks) 0.5
Step by Step Solution
There are 3 Steps involved in it

Get step-by-step solutions from verified subject matter experts