

Question: Question 2 (a) Using examples, outline the differences between correlation and causation. (6) The Excel correlation matrix below shows correlation coefficients between cheapest economy and
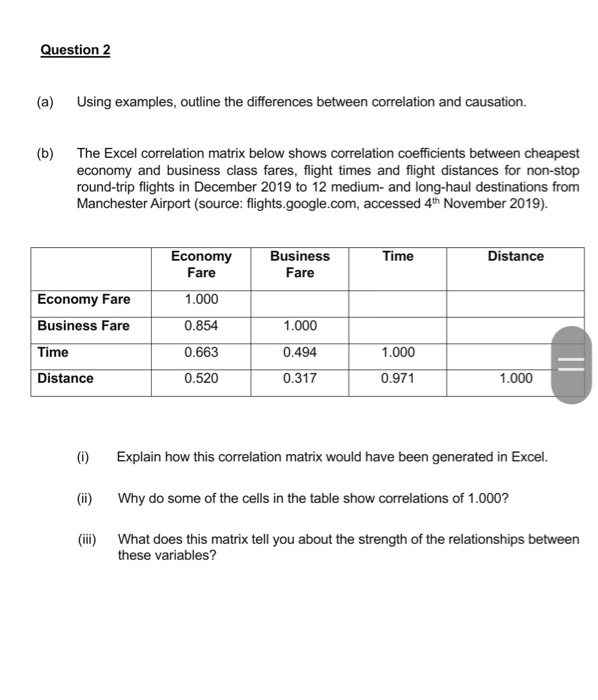
Question 2 (a) Using examples, outline the differences between correlation and causation. (6) The Excel correlation matrix below shows correlation coefficients between cheapest economy and business class fares, flight times and flight distances for non-stop round-trip flights in December 2019 to 12 medium- and long-haul destinations from Manchester Airport (source: flights.google.com, accessed 4th November 2019). Time Distance Economy Fare Business Fare 1.000 Economy Fare Business Fare 0.854 1.000 Time 0.494 0.663 0.520 1.000 0.971 Distance 0.317 1.000 (0) Explain how this correlation matrix would have been generated in Excel. (ii) Why do some of the cells in the table show correlations of 1.000? What does this matrix tell you about the strength of the relationships between these variables
Step by Step Solution
There are 3 Steps involved in it

Get step-by-step solutions from verified subject matter experts