

Question: Question 2 Based on your analysis in the previous section, as an Operational Manager write a brief report for the business owner. For full marks
Question 2 Based on your analysis in the previous section, as an Operational Manager write a brief report for the business owner. For full marks you must include the following:
1. Explain what each of the costs are in each of the seasons. Explain what causes the difference in the costs among the seasons. [5 marks]
2. Identify your areas of concerns and explain why they are a concern for this business. Ensure to focus on both cost and non-cost related issues. [10 marks]
3. As a consultant, itemize 5 recommendations to this business to help reduce its costs. [5 marks]
Note: This report is worth 20 marks... make sure to include detailed information to be able to earn full marks. The report should be well organized, easy to follow, and professionally written.
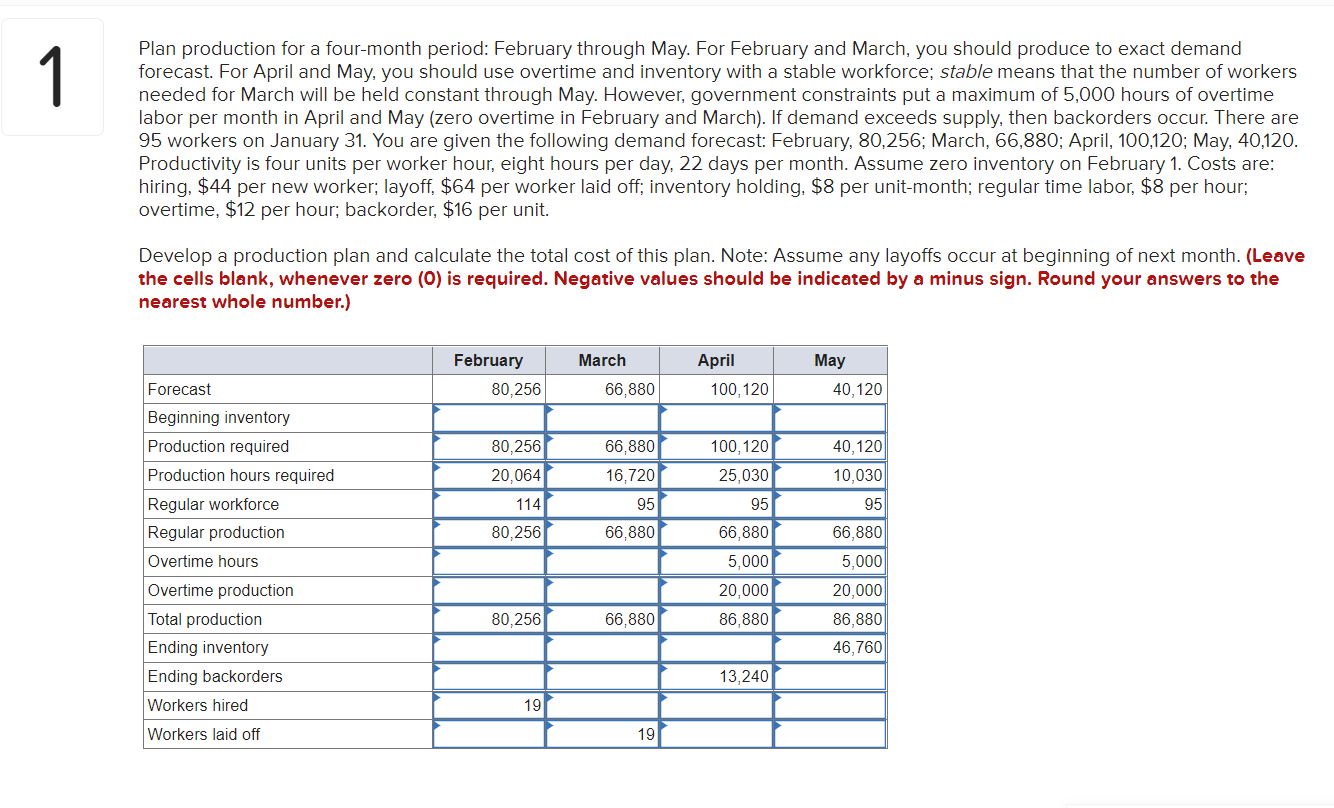
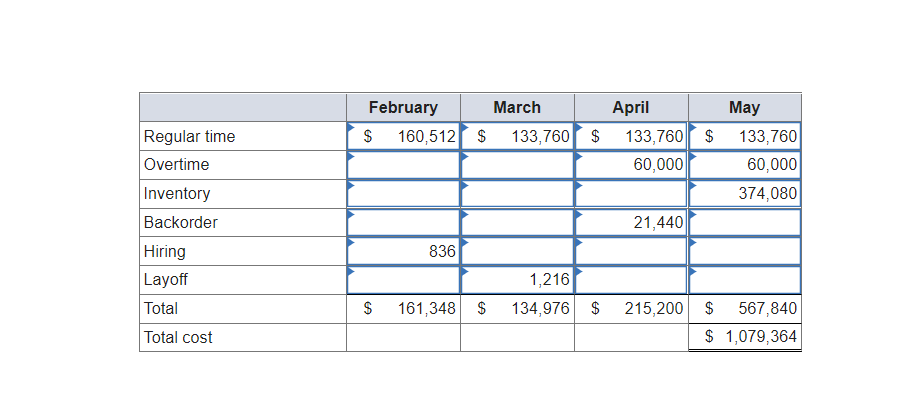
1 Plan production for a four-month period: February through May. For February and March, you should produce to exact demand forecast. For April and May, you should use overtime and inventory with a stable workforce; stable means that the number of workers needed for March will be held constant through May. However, government constraints put a maximum of 5,000 hours of overtime labor per month in April and May (zero overtime in February and March). If demand exceeds supply, then backorders occur. There are 95 workers on January 31. You are given the following demand forecast: February, 80,256; March, 66,880; April, 100,120; May, 40,120. Productivity is four units per worker hour, eight hours per day, 22 days per month. Assume zero inventory on February 1. Costs are: hiring, $44 per new worker; layoff, $64 per worker laid off; inventory holding, $8 per unit-month; regular time labor, $8 per hour; overtime, $12 per hour; backorder, $16 per unit. Develop a production plan and calculate the total cost of this plan. Note: Assume any layoffs occur at beginning of next month. (Leave the cells blank, whenever zero (0) is required. Negative values should be indicated by a minus sign. Round your answers to the nearest whole number.) March February 80,256 April 100,120 May 40,120 Forecast 66,880 80,256 20,064 40,120 10,030 66,880 16,720 95 66,880 114 100,120 25,030 95 66,880 5,000 95 Beginning inventory Production required Production hours required Regular workforce Regular production Overtime hours Overtime production Total production Ending inventory Ending backorders Workers hired 80,256 20,000 66,880 5,000 20,000 86,880 46,760 80,256 66,880 86,880 13,240 19 Workers laid off 19 February March $ 160,512 $ 133,760 $ April 133,760 $ 60,000 May 133,760 60,000 374,080 21,440 Regular time Overtime Inventory Backorder Hiring Layoff Total Total cost 836 $ 161,348 $ 1,216 134,976 $ 215,200 $ 567,840 $ 1,079,364Step by Step Solution
There are 3 Steps involved in it

Get step-by-step solutions from verified subject matter experts