

Question: question 2 Chapter 07, Section 7.1 , Additional Question 003 Your statistics teacher, knowing the power of sampling, decides to use only 3 of your
question 2
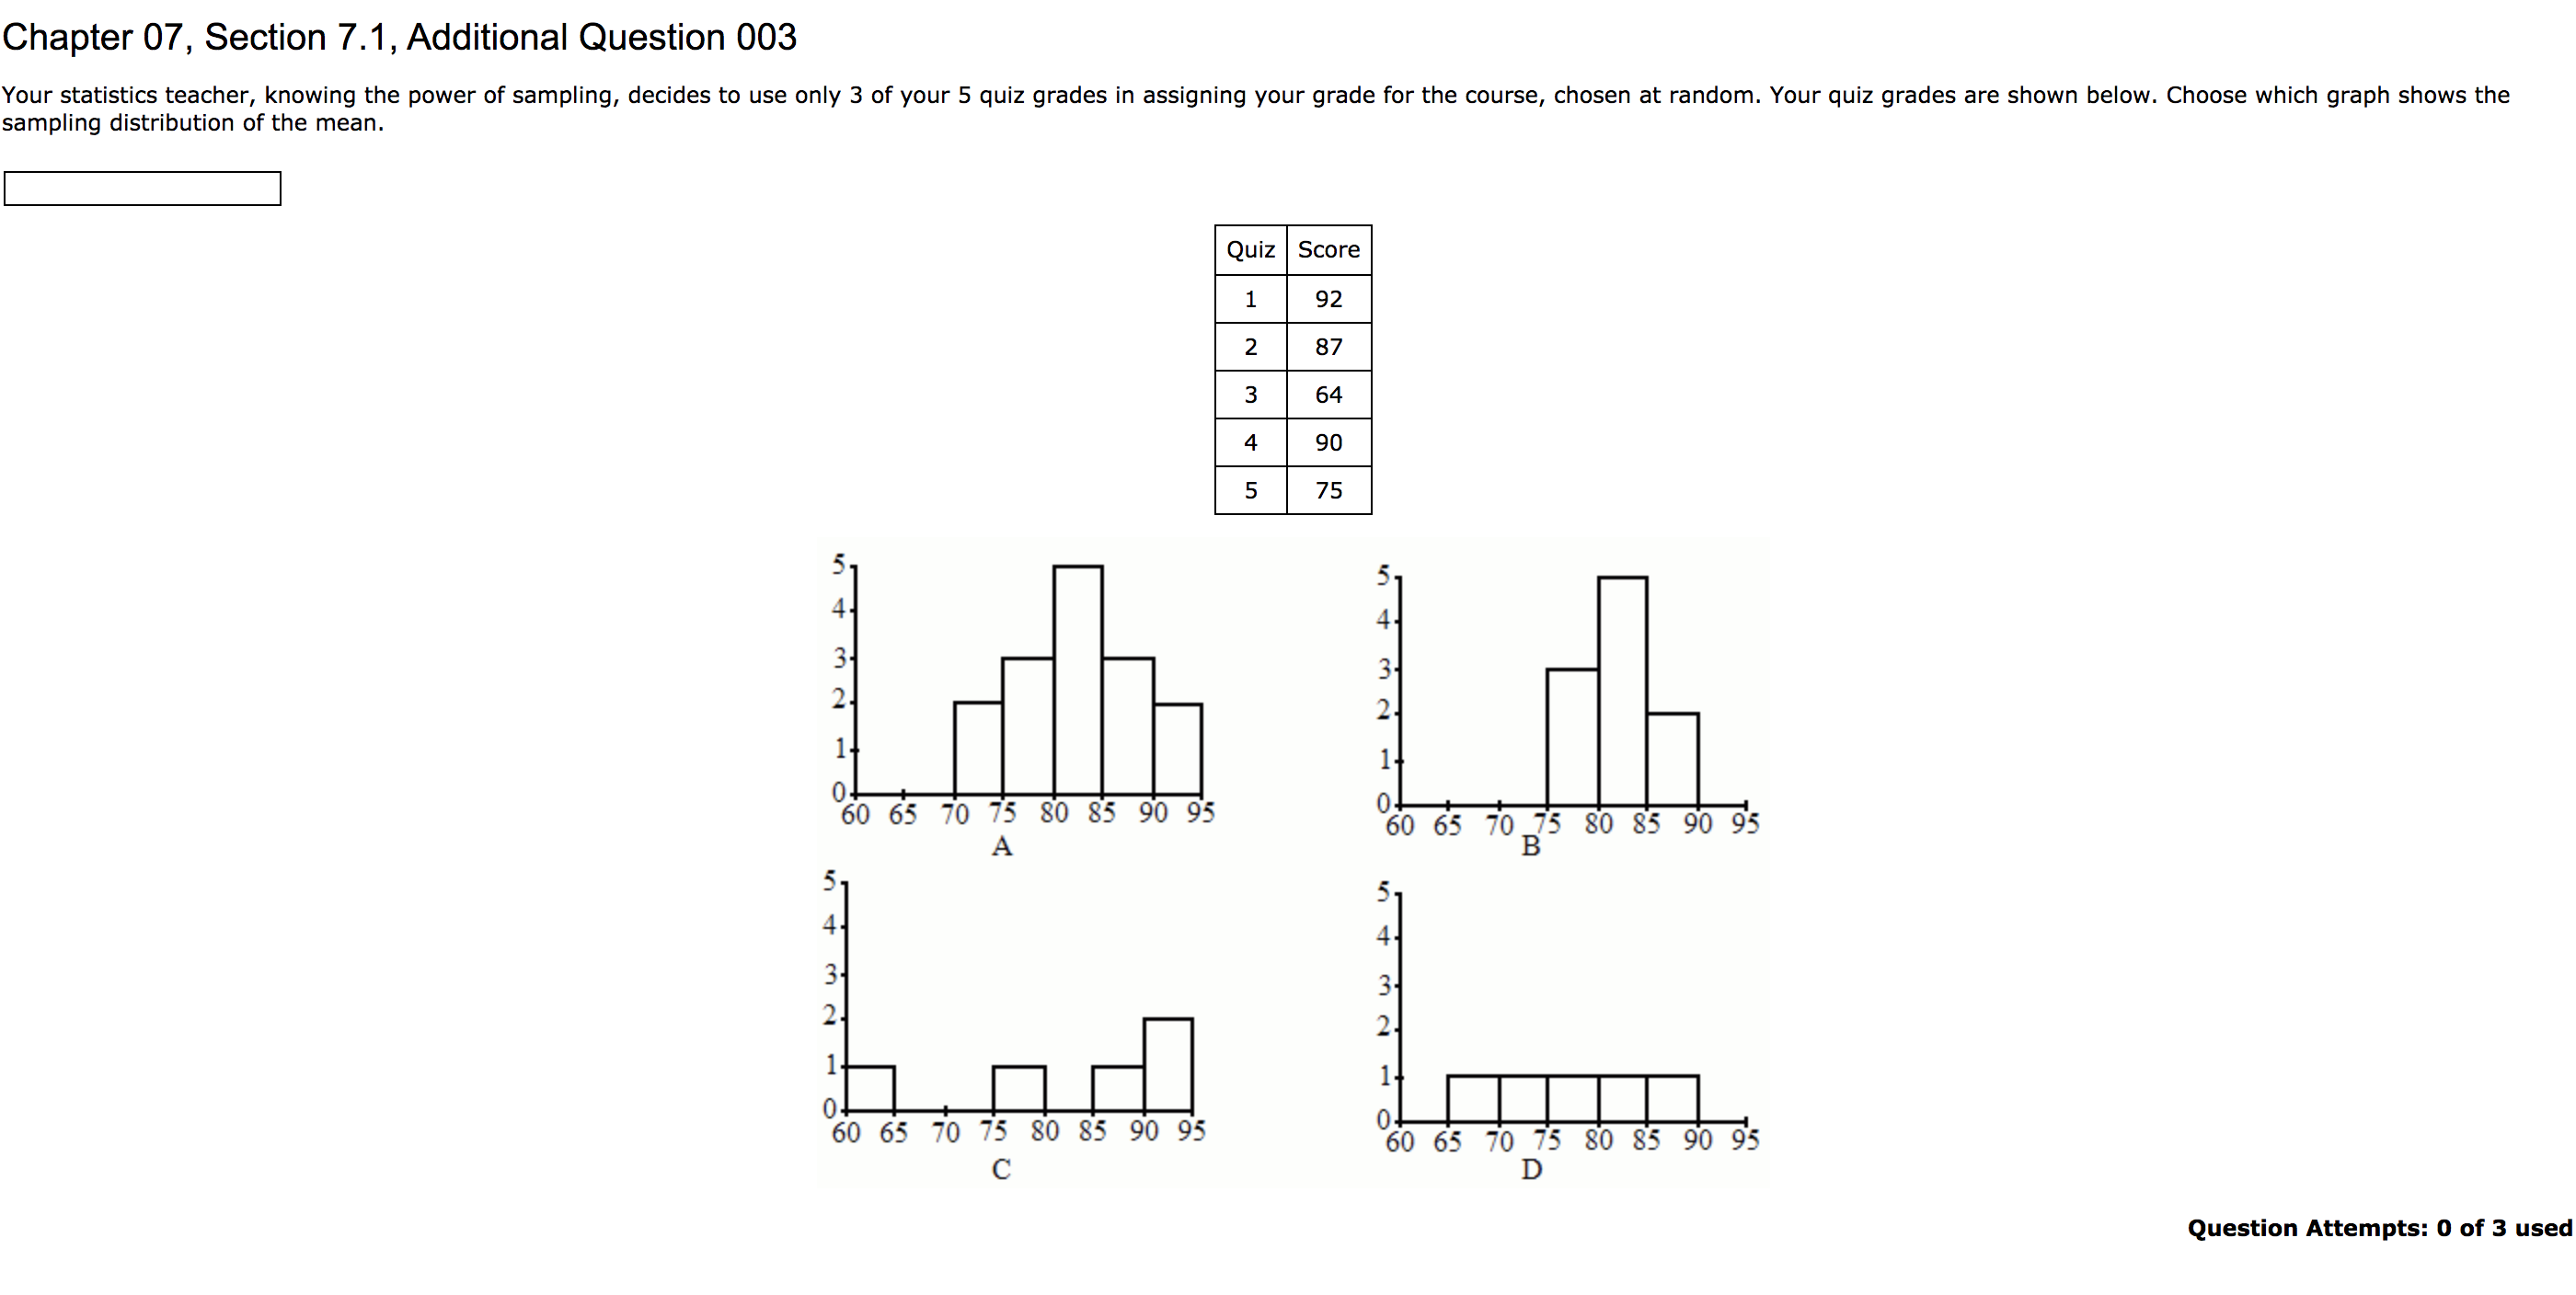
Chapter 07, Section 7.1 , Additional Question 003 Your statistics teacher, knowing the power of sampling, decides to use only 3 of your 5 quiz grades in assigning your grade for the course, chosen at random. Your quiz grades are shown below. Choose which graph shows the sampling distribution of the mean. Quiz Score 1 92 2 87 5 75 5 5 4 4 3 3 2 2 1 1 o 60 55 7 A5 30 85 9 95 060 65 70375 80 85 9o 95 5 5 4 4 3 3 2 2 1 1 o 60 55 7 75 8 85 9 95 060 65 7o 75 so 85 9o 95 c D Question Attempts: o of 3 used
Step by Step Solution
There are 3 Steps involved in it
1 Expert Approved Answer
Step: 1 Unlock

Question Has Been Solved by an Expert!
Get step-by-step solutions from verified subject matter experts
Step: 2 Unlock
Step: 3 Unlock