

Question: Question 2 Choose one table for each group and based on the table, students are required to answer these questions below, i. Draw a scatter


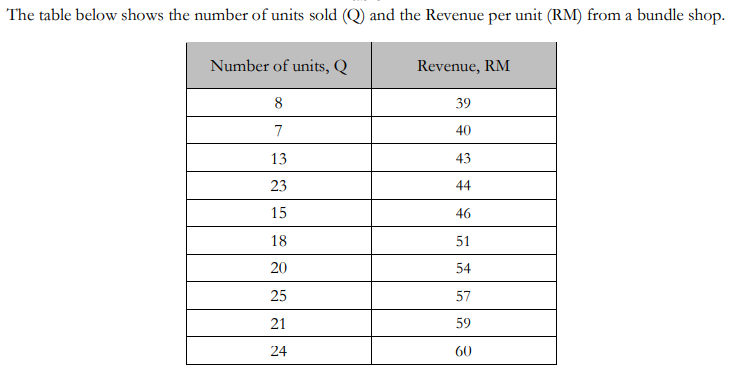
Question 2 Choose one table for each group and based on the table, students are required to answer these questions below, i. Draw a scatter diagram ii. Construct the regression line formula using least square method ili. Compute the Pearson's Product Moment Correlation Coefficient of the two variables and Comment on the strength of relationship iv. Compute the Spearman's Rank Correlation Coefficient of the two variables and comment on the strength of relationship.The table below shows the number of units sold (Q) and the Revenue per unit (RM) from a bundle shop. Number of units, Q Revenue, RM 8 39 7 40 13 43 23 44 15 46 18 51 20 54 25 57 21 59 24 60
Step by Step Solution
There are 3 Steps involved in it

Get step-by-step solutions from verified subject matter experts