

Question: Question 2: Compare Groups (30 Points) Continue with the subset Q1 created in Question 1 and answer the following questions. (a) What is the average
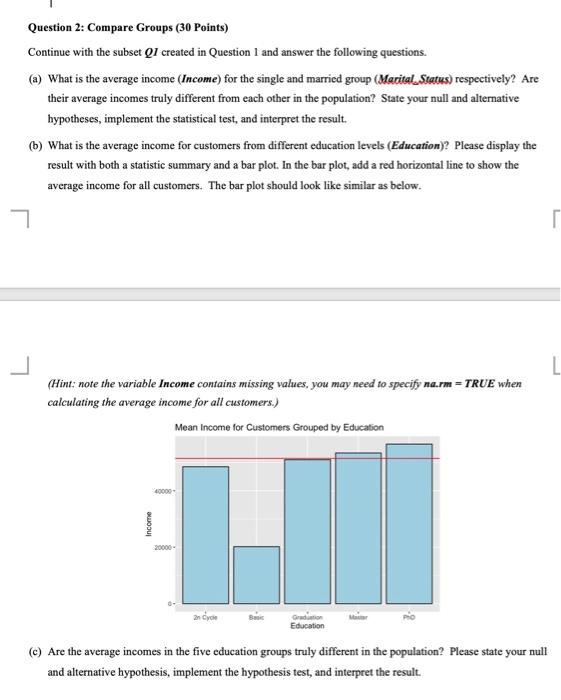
Question 2: Compare Groups (30 Points) Continue with the subset Q1 created in Question 1 and answer the following questions. (a) What is the average income (Income) for the single and married group (Marital_Status) respectively? Are their average incomes truly different from each other in the population? State your null and alternative hypotheses, implement the statistical test, and interpret the result. (b) What is the average income for customers from different education levels (Education)? Please display the result with both a statistic summary and a bar plot. In the bar plot, add a red horizontal line to show the average income for all customers. The bar plot should look like similar as below. (Hint: note the variable Income contains missing values, you may need to specify na.rm = TRUE when calculating the average income for all customers.) (c) Are the average incomes in the five education groups truly different in the population? Please state your null and alternative hypothesis, implement the hypothesis test, and interpret the result
Step by Step Solution
There are 3 Steps involved in it

Get step-by-step solutions from verified subject matter experts