

Question: Question 2 Congratulations! After completing your Advanced Spreadsheet Analysis course, you have been hired as a Portfolio Manager at Goldman Sachs. Your first task is
Question 2 Congratulations! After completing your Advanced Spreadsheet Analysis course, you have been hired as a Portfolio Manager at Goldman Sachs. Your first task is to analyze the profitability of the companies within your portfolio. Using the data below:
- Calculate the net profit margin for each year.
- Calculate the compound average annual growth rates (CAGR) for revenue and net income using the Geomean function. What is the Geomean function? What is Excels definition of it? Is net income growing more slowly or faster than total revenue? Is this a positive for your investment in the company?
- Using the Average function, calculate the annual growth rate of total revenue.
- Create a column chart of total revenue and net income. Change the chart so that the x-axis label contains the year numbers and format the axis so that 2020 is on the far-right side of the axis. For a little razzle dazzle, also choose a color for both net income and total revenue.
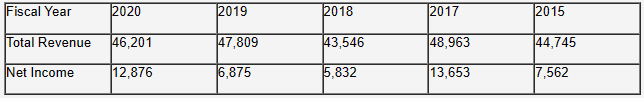
\begin{tabular}{|l|l|l|l|l|l|} \hline Fiscal Year & 2020 & 2019 & 2018 & 2017 & 2015 \\ \hline Total Revenue & 46,201 & 47,809 & 43,546 & 48,963 & 44,745 \\ \hline Net Income & 12,876 & 6,875 & 5,832 & 13,653 & 7,562 \\ \hline \end{tabular} \begin{tabular}{|l|l|l|l|l|l|} \hline Fiscal Year & 2020 & 2019 & 2018 & 2017 & 2015 \\ \hline Total Revenue & 46,201 & 47,809 & 43,546 & 48,963 & 44,745 \\ \hline Net Income & 12,876 & 6,875 & 5,832 & 13,653 & 7,562 \\ \hline \end{tabular}
Step by Step Solution
There are 3 Steps involved in it

Get step-by-step solutions from verified subject matter experts