

Question: Question 2: Consider the simulation model you did for Joines Chapter 2 (The ice cream store). At time zero, zero customers are in the system
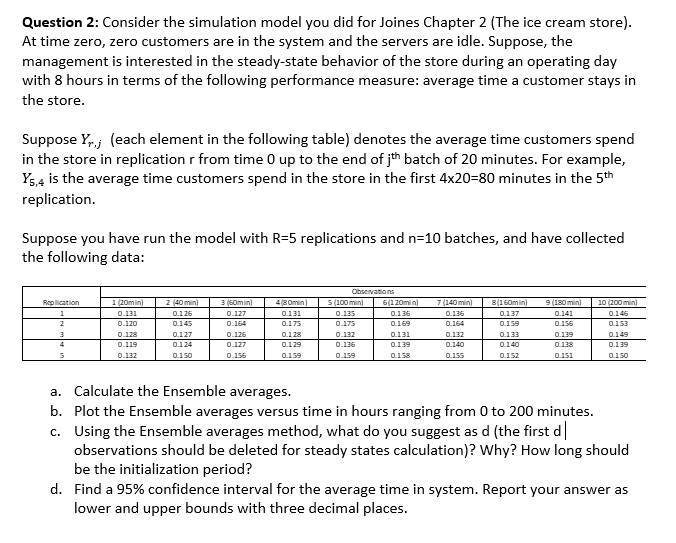
Question 2: Consider the simulation model you did for Joines Chapter 2 (The ice cream store). At time zero, zero customers are in the system and the servers are idle. Suppose, the management is interested in the steady-state behavior of the store during an operating day with 8 hours in terms of the following performance measure: average time a customer stays in the store. Suppose Yoj (each element in the following table) denotes the average time customers spend in the store in replication r from time 0 up to the end of jth batch of 20 minutes. For example, Y5,4 is the average time customers spend in the store in the first 4x20=80 minutes in the 5th replication. Suppose you have run the model with R=5 replications and n=10 batches, and have collected the following data: Replication 1 z 1 (20min) 0.131 0.120 0.128 0.119 0.132 2 (40 min) 0.126 0.145 0.127 0.124 0.150 3 (50min 0.127 0.164 0.125 0.127 0.156 48 min) 0.131 0.175 0.128 0.129 0.159 Observations 5 (100 min) 6(120min 0.125 0.135 0.175 0.169 0.132 0.131 0.136 0.139 0.159 0.158 7 (140 min) 0.125 0.164 0.132 0.140 8(1 60min) 0.137 0.159 0.133 0.140 0.152 9 (180 min) 0.141 0.156 0.139 0.138 0.151 10 (200 min) 0.145 0.153 0.149 0.139 0.150 4 5 0.155 a. Calculate the Ensemble averages. b. Plot the Ensemble averages versus time in hours ranging from 0 to 200 minutes. c. Using the Ensemble averages method, what do you suggest as d (the first d| observations should be deleted for steady states calculation)? Why? How long should be the initialization period? d. Find a 95% confidence interval for the average time in system. Report your answer as lower and upper bounds with three decimal places. Question 2: Consider the simulation model you did for Joines Chapter 2 (The ice cream store). At time zero, zero customers are in the system and the servers are idle. Suppose, the management is interested in the steady-state behavior of the store during an operating day with 8 hours in terms of the following performance measure: average time a customer stays in the store. Suppose Yoj (each element in the following table) denotes the average time customers spend in the store in replication r from time 0 up to the end of jth batch of 20 minutes. For example, Y5,4 is the average time customers spend in the store in the first 4x20=80 minutes in the 5th replication. Suppose you have run the model with R=5 replications and n=10 batches, and have collected the following data: Replication 1 z 1 (20min) 0.131 0.120 0.128 0.119 0.132 2 (40 min) 0.126 0.145 0.127 0.124 0.150 3 (50min 0.127 0.164 0.125 0.127 0.156 48 min) 0.131 0.175 0.128 0.129 0.159 Observations 5 (100 min) 6(120min 0.125 0.135 0.175 0.169 0.132 0.131 0.136 0.139 0.159 0.158 7 (140 min) 0.125 0.164 0.132 0.140 8(1 60min) 0.137 0.159 0.133 0.140 0.152 9 (180 min) 0.141 0.156 0.139 0.138 0.151 10 (200 min) 0.145 0.153 0.149 0.139 0.150 4 5 0.155 a. Calculate the Ensemble averages. b. Plot the Ensemble averages versus time in hours ranging from 0 to 200 minutes. c. Using the Ensemble averages method, what do you suggest as d (the first d| observations should be deleted for steady states calculation)? Why? How long should be the initialization period? d. Find a 95% confidence interval for the average time in system. Report your answer as lower and upper bounds with three decimal places
Step by Step Solution
There are 3 Steps involved in it

Get step-by-step solutions from verified subject matter experts