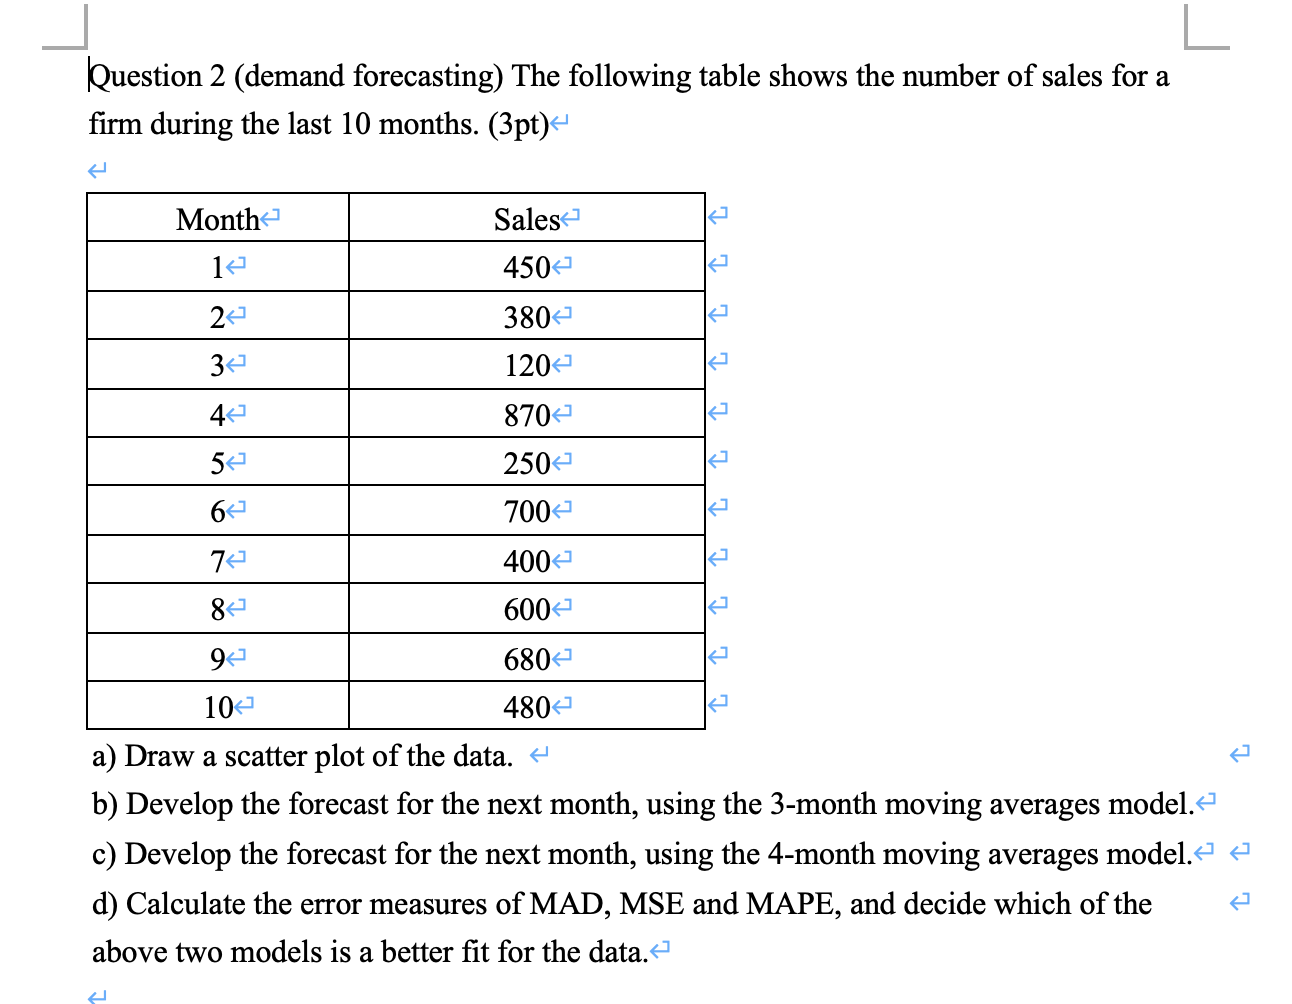
Question: Question 2 (demand forecasting) The following table shows the number of sales for a firm during the last 10 months. (3pt) a) Draw a scatter

Question 2 (demand forecasting) The following

Question 2 (demand forecasting) The following table shows the number of sales for a firm during the last 10 months. (3pt) a) Draw a scatter plot of the data. b) Develop the forecast for the next month, using the 3-month moving averages model. c) Develop the forecast for the next month, using the 4-month moving averages model. d) Calculate the error measures of MAD, MSE and MAPE, and decide which of the above two models is a better fit for the data

Step by Step Solution

There are 3 Steps involved in it

1 Expert Approved Answer
Step: 1 Unlock blur-text-image
Question Has Been Solved by an Expert!

Get step-by-step solutions from verified subject matter experts

Step: 2 Unlock
Step: 3 Unlock

Students Have Also Explored These Related General Management Questions!