

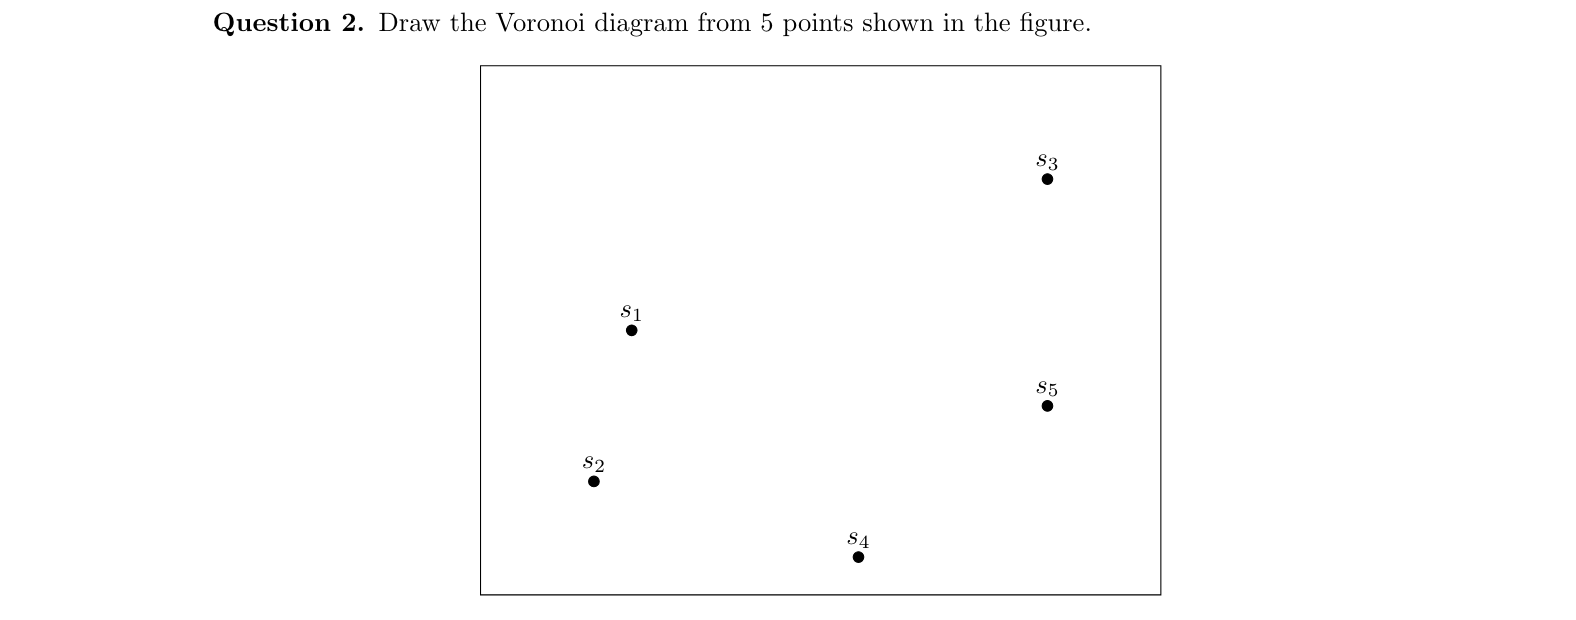
Question: Question 2 . Draw the Voronoi diagram from 5 points shown in the figure. Question 3 . Determine for sites s 2 , s 3
Question Draw the Voronoi diagram from points shown in the figure.
Question Determine for sites s s s if we run Gonzalezs algorithm for the data points shown in
the figure, starting from s Circle the clusters.
Question Run Lloyds algorithm with k for the data shown in the figure. Determine roughly the
positions of the sites at the end of the first two iterations. Does the algorithm stop after iterations?
Step by Step Solution
There are 3 Steps involved in it
1 Expert Approved Answer
Step: 1 Unlock

Question Has Been Solved by an Expert!
Get step-by-step solutions from verified subject matter experts
Step: 2 Unlock
Step: 3 Unlock