

Question: . Question 2 E 3 pts '9 1 G) Details The table below contains pulse rates after running for 1 minute, collected from a random

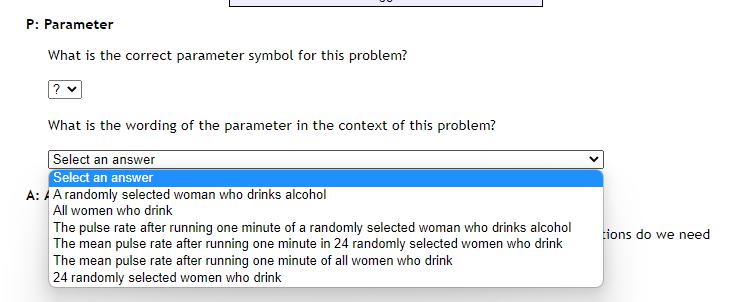


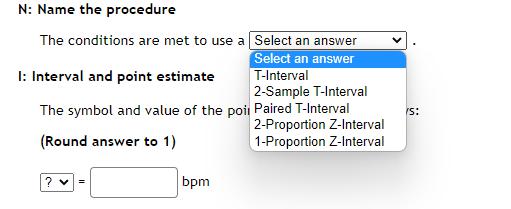

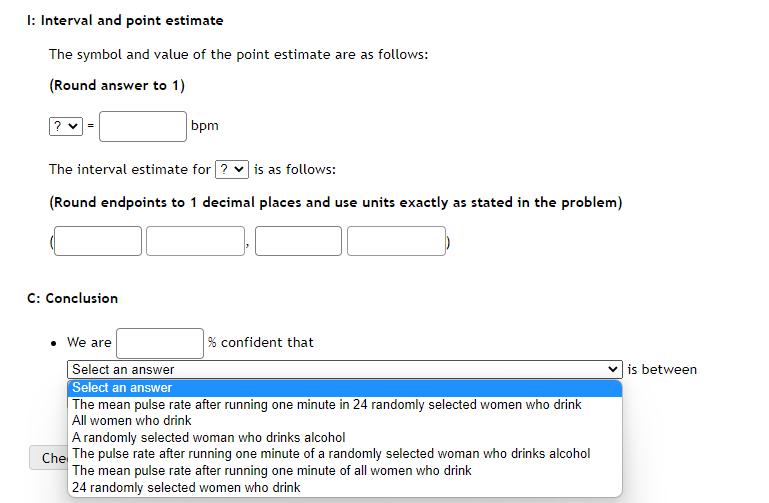
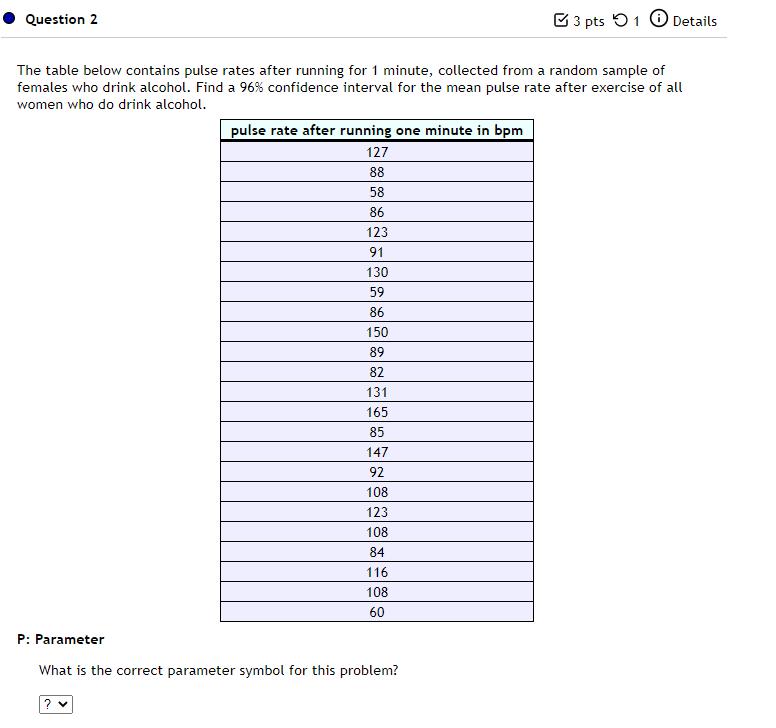

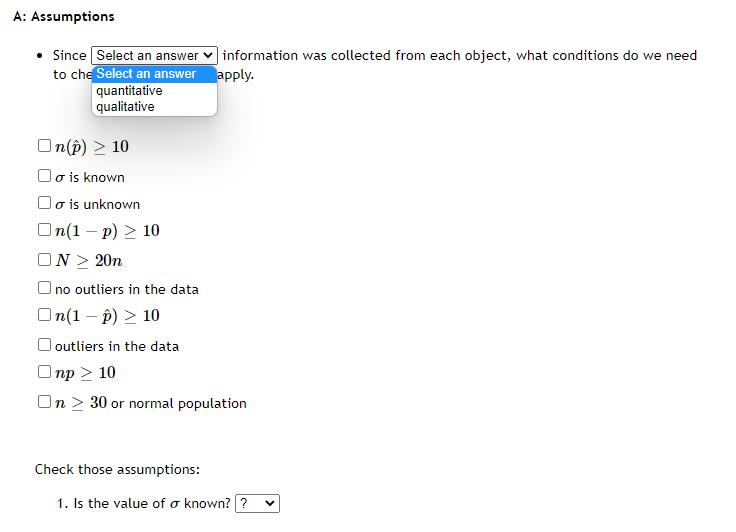
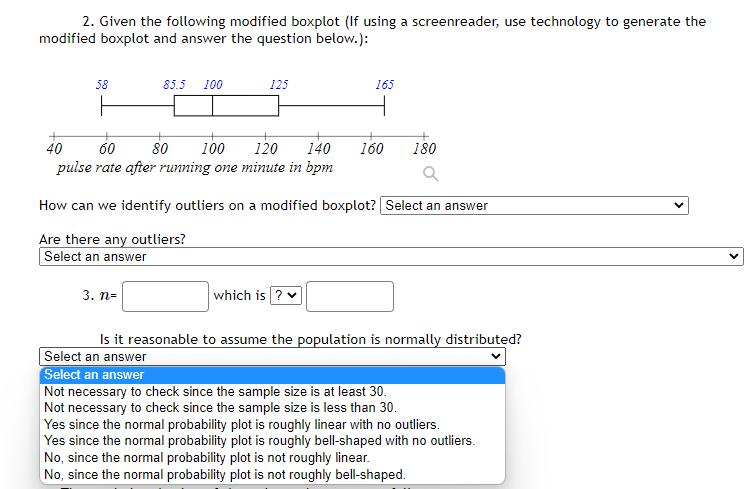

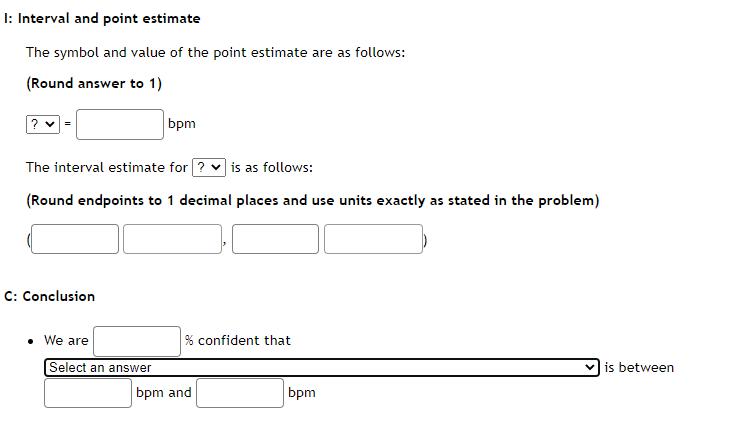

. Question 2 E 3 pts '9 1 G) Details The table below contains pulse rates after running for 1 minute, collected from a random sample of females who drink alcohol. Find a 96% confidence interval for the mean pulse rate after exercise of all women who do drink alcohol. P: Parameter pulse rate after running one minute in bpm 12? L11 DC! DC! M MD M What is the correct parameter symbol for this problem? P: Parameter What is the correct parameter symbol for this problem? ? v What is the wording of the parameter in the context of this problem? Select an answer Select an answer A: / A randomly selected woman who drinks alcohol All women who drink The pulse rate after running one minute of a randomly selected woman who drinks alcohol tions do we need The mean pulse rate after running one minute in 24 randomly selected women who drink The mean pulse rate after running one minute of all women who drink 24 randomly selected women who drinkA: Assumptions . Since Select an answer v information was collected from each object, what conditions do we need to che Select an answer apply. quantitative qualitative On(p) > 10 Do is known Do is unknown On(1 -p) >10 ON >20n no outliers in the data On(1 -p) > 10 outliers in the data Onp > 10 On > 30 or normal population Check those assumptions: 1. Is the value of o known? ? v2. Given the following modified boxplot (If using a screenreader, use technology to generate the modified boxplot and answer the question below. ): 58 85.5 100 125 165 40 60 80 100 120 140 160 180 pulse rate after running one minute in bom Q How can we identify outliers on a modified boxplot? Select an answer v Are there any outliers? Select an answer V 3. n= which is ? v Is it reasonable to assume the population is normally distributed? Select an answer Select an answer Not necessary to check since the sample size is at least 30. Not necessary to check since the sample size is less than 30. Yes since the normal probability plot is roughly linear with no outliers. Yes since the normal probability plot is roughly bell-shaped with no outliers. No, since the normal probability plot is not roughly linear. No, since the normal probability plot is not roughly bell-shaped.N: Name the procedure The conditions are met to use a Select an answer Select an answer I: Interval and point estimate T-Interval 2-Sample T-Interval The symbol and value of the poil Paired T-Interval 2-Proportion Z-Interval 'Round answer to 1) 1-Proportion Z-Interval bomI: Interval and point estimate The symbol and value of the point estimate are as follow-wt: [Round answer to 1] The interval estimate for is as follows: [Round endpoints to 1 decimal plaoes and use units exactly as stated in the problem} {:1 |:, [:1 |:|I (2: Conclusion I We are [j '36 confident that Select an answer V is between I: Interval and point estimate The symbol and value of the point estimate are as follows: (Round answer to 1) ? bom The interval estimate for ? | is as follows: (Round endpoints to 1 decimal places and use units exactly as stated in the problem) C: Conclusion We are confident that Select an answer V is between Select an answer The mean pulse rate after running one minute in 24 randomly selected women who drink All women who drink A randomly selected woman who drinks alcohol Che The pulse rate after running one minute of a randomly selected woman who drinks alcohol The mean pulse rate after running one minute of all women who drink 24 randomly selected women who drink
Step by Step Solution
There are 3 Steps involved in it

Get step-by-step solutions from verified subject matter experts