Question: Question 2 --- Forecasting (100 points) IDENTIFY --- a personal example that you will use to answer this question. Create YOUR unique Forecasting story!!! DEFINE
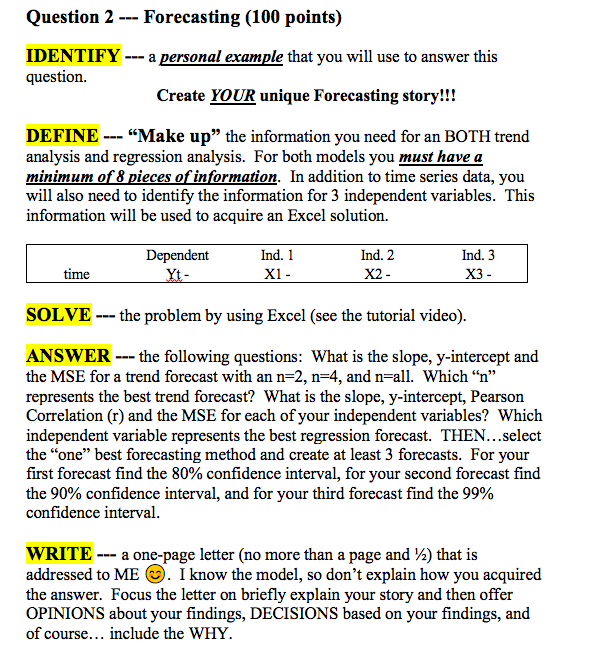
Question 2 --- Forecasting (100 points) IDENTIFY --- a personal example that you will use to answer this question. Create YOUR unique Forecasting story!!! DEFINE --- "Make up" the information you need for an BOTH trend analysis and regression analysis. For both models you must have a minimum of 8 pieces of information. In addition to time series data, you will also need to identify the information for 3 independent variables. This information will be used to acquire an Excel solution. Dependent Yt - Ind. 1 X1 - Ind. 2 X2 - Ind. 3 X3 - time SOLVE --- the problem by using Excel (see the tutorial video). ANSWER --- the following questions: What is the slope, y-intercept and the MSE for a trend forecast with an n=2, n=4, and n=all. Which "n" represents the best trend forecast? What is the slope, y-intercept, Pearson Correlation (r) and the MSE for each of your independent variables? Which independent variable represents the best regression forecast. THEN...select the "one" best forecasting method and create at least 3 forecasts. For your first forecast find the 80% confidence interval, for your second forecast find the 90% confidence interval, and for your third forecast find the 99% confidence interval. WRITE --- a one-page letter (no more than a page and 7) that is addressed to ME . I know the model, so don't explain how you acquired the answer. Focus the letter on briefly explain your story and then offer OPINIONS about your findings, DECISIONS based on your findings, and of course... include the WHY. Question 2 --- Forecasting (100 points) IDENTIFY --- a personal example that you will use to answer this question. Create YOUR unique Forecasting story!!! DEFINE --- "Make up" the information you need for an BOTH trend analysis and regression analysis. For both models you must have a minimum of 8 pieces of information. In addition to time series data, you will also need to identify the information for 3 independent variables. This information will be used to acquire an Excel solution. Dependent Yt - Ind. 1 X1 - Ind. 2 X2 - Ind. 3 X3 - time SOLVE --- the problem by using Excel (see the tutorial video). ANSWER --- the following questions: What is the slope, y-intercept and the MSE for a trend forecast with an n=2, n=4, and n=all. Which "n" represents the best trend forecast? What is the slope, y-intercept, Pearson Correlation (r) and the MSE for each of your independent variables? Which independent variable represents the best regression forecast. THEN...select the "one" best forecasting method and create at least 3 forecasts. For your first forecast find the 80% confidence interval, for your second forecast find the 90% confidence interval, and for your third forecast find the 99% confidence interval. WRITE --- a one-page letter (no more than a page and 7) that is addressed to ME . I know the model, so don't explain how you acquired the answer. Focus the letter on briefly explain your story and then offer OPINIONS about your findings, DECISIONS based on your findings, and of course... include the WHY


