

Question: Question 2: Given below a data set for sales for a product sold by given company. Use the data to answer the following questions. begin{tabular}{|c|cc|}
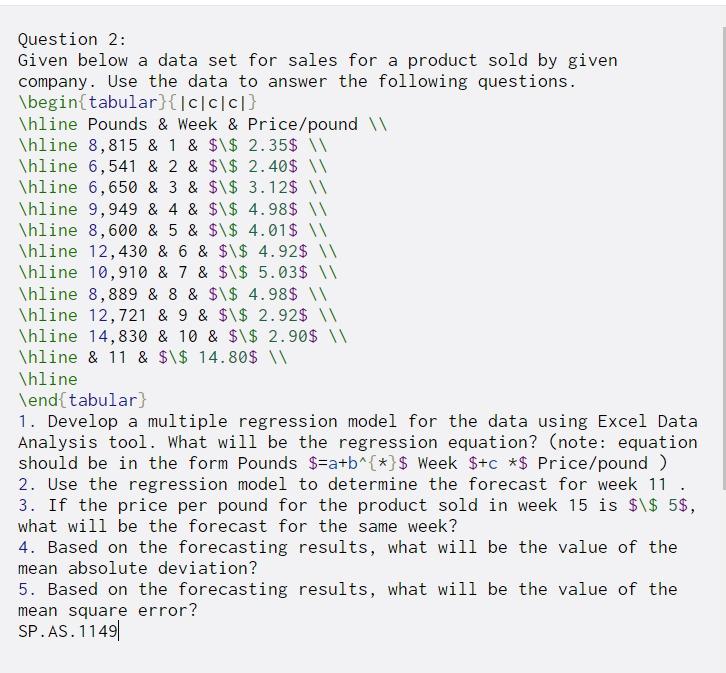
Question 2: Given below a data set for sales for a product sold by given company. Use the data to answer the following questions. \begin{tabular}{|c|cc|} \hline Pounds & Week & Price/pound Thline 8,815 & 1 & $\$ 2.35$ \ \hline 6,541 & 2 & $\$ 2.40$ \hline 6,650 & 3 & $ $ 3.12$ \hline 9,949 & 4 & $\$ 4.98$ \hline 8,600 & 5 & $\$ 4.01$ Thline 12,430 & 6 & $\$ 4.92$ \hline 10,910 & 7 & $\$ 5.03$ \hline 8,889 & 8 & $\$ 4.98$ \hline 12,721 & 9 & $\$ 2.92$ \hline 14,830 & 10 & $\$ 2.90$ \hline & 11 & $\$ 14.80$ W \hline \end{tabular) 1. Develop a multiple regression model for the data using Excel Data Analysis tool. What will be the regression equation? (note: equation should be in the form Pounds $=a+b^{*}$ Week $+c *$ Price/pound ) 2. Use the regression model to determine the forecast for week 11 . 3. If the price per pound for the product sold in week 15 is $\$ 5$, what will be the forecast for the same week? 4. Based on the forecasting results, what will be the value of the mean absolute deviation? 5. Based on the forecasting results, what will be the value of the mean square error? SP.AS. 1149
Step by Step Solution
There are 3 Steps involved in it

Get step-by-step solutions from verified subject matter experts