

Question: Question 2: I'm going to give you the data needed for this problem below. Construct a control chart to examine if the total number of
Question 2: I'm going to give you the data needed for this problem below. Construct a control chart to examine if the total number of hours of restraints has changed over time. In this sheet, select the chart, verify the assumptions, display the control chart and interpret the results.
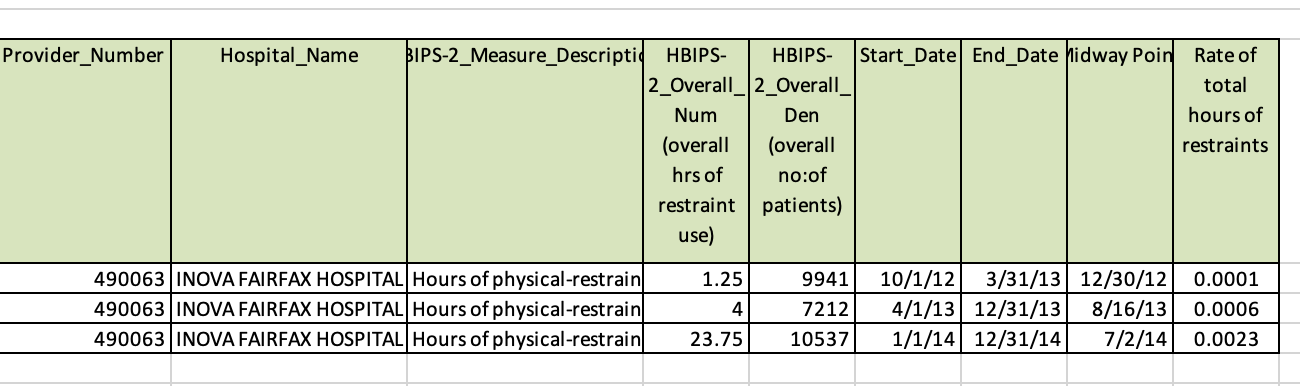
Provider_Number Hospital_Name Start_Date End_Date hidway Poin Rate of BIPS-2_Measure_Descriptid HBIPS- HBIPS- |2_Overall_12_Overall_ total Num Den hours of (overall restraints (overall no:of hrs of restraint patients) use) 1.25 9941 0.0001 490063 INOVA FAIRFAX HOSPITAL Hours of physical-restrain 490063 INOVA FAIRFAX HOSPITAL Hours of physical-restrain 490063 INOVA FAIRFAX HOSPITAL Hours of physical-restrain 4 7212 10/1/12 3/31/13 12/30/12 4/1/13 12/31/13 8/16/13 1/1/14 12/31/14 7/2/14 0.0006 23.75 10537 0.0023 Provider_Number Hospital_Name Start_Date End_Date hidway Poin Rate of BIPS-2_Measure_Descriptid HBIPS- HBIPS- |2_Overall_12_Overall_ total Num Den hours of (overall restraints (overall no:of hrs of restraint patients) use) 1.25 9941 0.0001 490063 INOVA FAIRFAX HOSPITAL Hours of physical-restrain 490063 INOVA FAIRFAX HOSPITAL Hours of physical-restrain 490063 INOVA FAIRFAX HOSPITAL Hours of physical-restrain 4 7212 10/1/12 3/31/13 12/30/12 4/1/13 12/31/13 8/16/13 1/1/14 12/31/14 7/2/14 0.0006 23.75 10537 0.0023
Step by Step Solution
There are 3 Steps involved in it

Get step-by-step solutions from verified subject matter experts